Showing posts with label usd. Show all posts

Monday, April 13, 2015

2015 Quarter 2 FOREX Outlook

Looks like Q1 went just as I planned it would. I took the time to highlight some of the highest growth potential pairs in the FOREX markets. Quarter 2 of this year looks like it has some big plays for traders and investors alike. In this article we will explore some of those opportunities.

First let's look back at the top 3 major pairs over the past three months.
USD:
The dollar rose significantly against every pair except the Swiss Franc. Some potential pairs to trade that stood out to me were EURUSD, USDJPY, and GBPUSD. To be more specific, I have set a target for selling the EURUSD into .97000.
I have set a 122.000 target for USDJPY and a GBPUSD target of 1.42300 to sell into.
GBP:
The pound had a rough time carving out any significant gains or losses due to a mix of sell-offs and rallies between all of the major crosses. GBPJPY has been stuck in a range between 185.000 and 175.000 which makes me weary of engaging in any trades with this pair. If I do it will be within the range or for a breakout above 185.000. GBPCHF sold off heavily and rallied to fill the gap only to turn back around and tick back down towards the middle of the gap.
GBPUSD should continue lower into my target of 1.42300. Along with this we have GBPNZD which I have set a target range of 1.94 and 1.92 for traders to sell into.

EUR:
The EURO was the at the butt of everyone's trades. This currency was sold off more than any other pair in the major currency markets. Above is an illustration of EURGBP which was sold off very heavily in the first quarter. I see this selling continuing and I've set a target of .7000 but not before the market retraces a bit into .75000 and then sending the pair lower. Again I put emphasis on a EURUSD .97000 target. EURJPY will be falling a little more this quarter and I have set a target of 120.000 for the pair seeing as how the JPY needs some relief from being sold by all the other major crosses. 

Wednesday, February 4, 2015

Top 2015 Forex Trades

This year will be a good year for the Forex Markets. With a slew of important economic news coming out of the European and Japanese regions. Recently published, our 2015 Forex Outlook details the technical and fundamental factors that are the foundation for the trades in this report. The 3 major currencies USD, EUR, and GBP offer some of the greatest opportunities for growth based on analysis of fundamental analysis of upcoming news events and technical analysis of specific pairs that are directly affected by the news.  
USDJPY:
The USD has experienced some serious growth through 2014 and it looks as if this trend will continue at least half way through 2015. The BOJ wants to ignite some inflationary pressure on its economy through some more huge stimulus plans and the US wants to raise its lending rates this year. That equals a buy for the dollar and a sell for the yen. 
On this monthly chart we can clearly see that the USDJPY has rebounded substantially and following the trend is the name of the game. A good buy entry would be at 115.000 and an initial profit target is set at 125.000. The next profit target is 135.000. The stop loss limit for this target is 110.000. That's a 500 pip risk for a 2000 pip gain; 1:4 risk/reward ratio.   

EURGBP:
The EUR has been the bottom of everyone's trade since 2014 and with Greece's General Election results it looks like the selling will continue. The EURGBP is a perfect pair to take advantage of this situation with the technicals of this instrument are telling us the pressure to the downside is real.
The best entry to exploit this trade is to find resistance around .7800 and sell into the next major support at .7000. The stop loss limit for this .8000. These levels leave us with a 200 pip risk and a 800 pip reward; 1:4 risk/reward ratio.

EURUSD:
Still the most traded currency pair in the Forex Markets. On a monthly chart we see that the technicals have truly slid into bears' territory. The pair has broken below the major 1.2000 support.
The volatility of this pair leaves us with no choice but to trade this pair using wide ranges for our orders. The best sell entry is actually a zone. Between 1.19000 and 1.2050 is the recent support zone broken and will turn to our new entry zone. 1.35000 is the stop loss limit price. The best scenario and most probable will be the price of this pair dropping to parity at 1.0000. The next profit target will be .90000; That's roughly a 1:2 risk/reward ratio.  

GBPCHF:
The Swiss bank finally removed its CHF ceiling and has cleared a path for CHF bulls. The techincal truth about this pair is that the selling trend has been in demand for nearly a decade and the pair's price has moved below a serious moving average line.
A great entry level would be a sell from 1.50000. A stop loss limit would be perfect just above the high of the recent leg lower which is 1.55400. The lowest low is the profit target to aim for at 1.15000. That's a risk of 540 pips and a potential reward of 3,500 pips; roughly 1:6.5 risk/reward ratio!

These trades offer exposure to some of the Forex Markets most plausible and profitable fluctuations. They also work in concert with each-other creating synergy through the hedging strategy. We are buying the dollar through our EURUSD sell and USDJPY buy. We are selling the EURO through our EURUSD and EURGBP sells. We are safe from a flat GBP with our EURGBP sell and GBPCHF sell which will give us insight to the strength and market sentiment which is hard to analyze in the GBP at this point.  

Friday, October 10, 2014

The Fate Of The USD

So as we all know the FOMC will be meeting again to announce their almighty important notes and we traders need to be on out toes. I want to take the time to go over some of the most important currency pairs during these hours of waiting. In This report we'll cover the most traded USD pairs available, EURUSD GBPUSD, USDCAD, USDJPY, and AUDUSD.
GBPUSD: This pair has taken a turn towards the stars and looks like it could be reversing its current downtrend. Since July this pair has been steadily drifting lower and lower and reached a yearly low of 1.60000 which acted as support for some congested trading going back to...get this...October of last year...and also the 50% Fibonacci retracement price. On the daily chart below we can see the confluence in color.
After the first test of the low the pair sprang back up to 1.64000 where it was rejected and once again fell to and then below 1.60000 before is was pressed back up to 1.61585. On the hourly chart below we can get a closer look at how this pair has been performing with this weeks movements highlighted in blue. From 1.60000 the pair took a steady path up and actually rose above its resistance before it was pressed back below it. This tells me that the traders want prices above this and their only preparing the situation strategically; so should you. 
I would be looking to sell this pair from 1.61585 and buy it at 1.60000 keeping a close eye on it just in case the banks want to take the price a step lower to the 61.8% Fibonacci at 1.57000, another great place to buy. 

EURUSD: This Pair looks like a little more fun. It has taken its drop step by step, almost in perfect lock step formation as far as the 240min chart shows. We can see from the chart below that this pair has found some good support around 1.25500. From There it has been on a consistent march back up towards the 61.8% Fibonacci level it broke about a week and a half ago. It was rejected back down from there and ended up being supported just at 1.26650 which also acted as resistance on the way down. It's good to see the bank traders are respecting technical levels. 
I'd be looking to buy this pair from or near 1.26650 with some bias to the downside so watch your position with caution as this pair has been known to be hella volatile. 

USDCAD: Is a completely different beast. This pair has seen some serious congestion where traders are sending the price flying and falling all within 1 or 2 sessions. On a 60min chart we can observe that this pair is still being supported by its original up trend support line but it does look to be losing some steam as far as the bulls are concerned. Around 1.11600 would be the level I'd sell from IF I was going to make any trade. I don't see much more upside potential in this pair and I don't think the banks are ready to lower it out of its uptrend just yet (think manipulation) 
AUDUSD: Is another pair which looks to be turning its tides from being a seller to being a buyer. Over the past week we've seen the price hit its most recent lows only to pick up Monday with nothing but buyer behind it. Though this pair has been seriously volatile we can clearly see its upswing and potential for more bullish moves. Price us testing near term support around .87500 where we could see the price bounce and continue its uptrend. I want to see .88800 cleared before I step in for a buy only because of this pair history of volatility especially during odd hours. 
 And last but not least,

USDJPY: This pair reached awesome new highs and then....nothing. It's been so lackluster I wouldn't even suggest a trade if you're not already in a successful position already. If you are in a position I hope it's a long position and I would only suggest buying more while you have a chance before the hike towards 115.000 which probably won't take long considering all the stalling that's going on in the pair now. Below on a 60min chart we can see the consolidated trading of this pair. 

Friday, October 3, 2014

Hacked Market Trades Made Me Over $10k

This week has been a pretty lackluster one in my opinion. Not good for trend trading but an awesome week for some day trades. I made Over $10,000 in USDJPY by holding on to the rest of my long position from way back when I bought it at 105.00 and I intend to hold it even longer after seeing the markets Post-ECB emotions.
On a 240min chart we can see the uptrend begin to consolidate but still provide us with small momentum towards the upside. This may not be the best environment to try to buy and hold any trades more than a few hours to a day at most. 
For a view of something we could've actually traded we should move to down to a 60min chart. Below on the chart we can see highlighted in blue a 5 day view of this pairs movement; What we observe is that this pair provided at least 15 pips everyday that could have been sucked out of some day trades. Monday we rose during the London Session only reverse the entire move + some. Tuesday We see the pair rise 15+ pips during late London/Early New York Sessions and consolidate into the end of the day. Wednesday Was an awesome day because we got to see the pair test 110.00 for resistance twice only to fall 20+ pips. The Fall continued into Thursday and reached a floor towards the end of the New York Session. Once the floor was reached during the Asian Session the pair decided to march over 100 pips which lasted through Today's London Session and New York Session. 
If you were looking for some action this week USDJPY was just one pair that provided daily pips for the acute traders. 

Wednesday, September 10, 2014

I CAN'T BELIEVE I'M THIS LUCKY!!

OMG, I have to be the luckiest trader alive right now. So I was able to play the USDJPY breakout and it has essentially played out perfectly so far. On Friday, September 5, I bought 500,000 lots at 104.908 and haven't looked back since. The pair has been on a steady climb since the small retracement to weekly lows last Friday. Below is a figure of the hourly chart showing my entry level and this pairs progress.
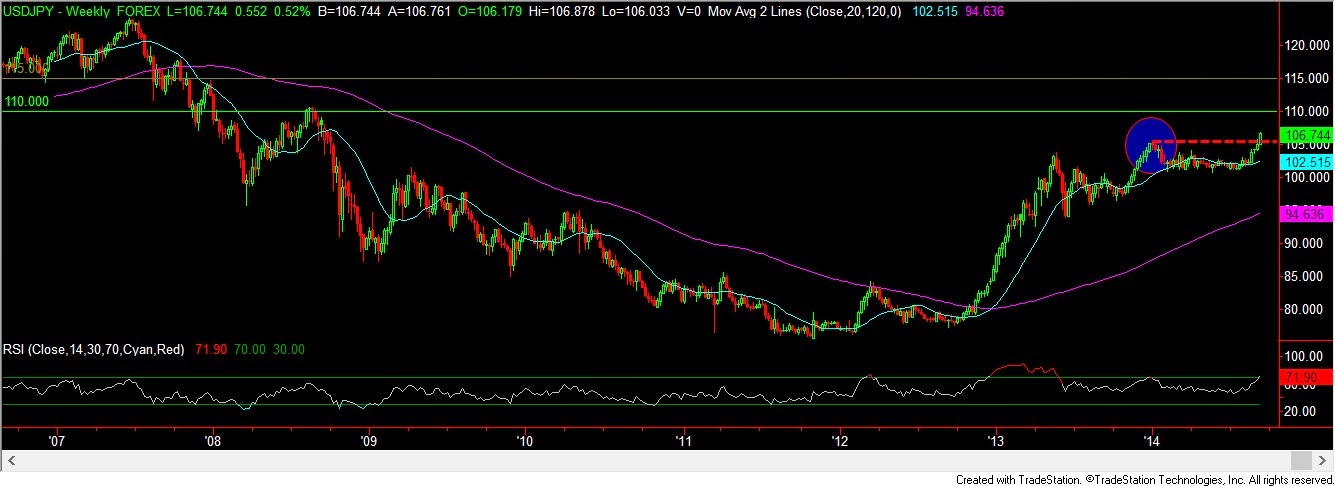
My targets are at 110.00 and 115.00. I'd love to sit here all day to explain but pictures say 1,000 words + ya'll aren't paying me yet so you have to connect the dots yourselves. lol. First I'll show you my view of this pairs weekly view to show you some relevant history.
 So I'm hoping the figure above helps you a bit. Next you should understand whats likely to play-out for USDJPY. Examine the figure below of this pair's monthly candlestick chart. To imagine what will come next simply turn the chart up-side down or flip it over.(lol). This might be confusing but you'll soon see, what comes around goes around.
Be prepared for the selling but don't forget about histroy's lesson to us. This pair has levels to meet as the chart above tells us...stay tuned.
So far this pair has already profited me over $9,000. 

Wednesday, July 23, 2014

Low-Volatility - Swing Trades Pt. 1.3

So it's clear that today showed a lot of indecision in the EUR/USD. The pair stayed in a tight range all day but still below the 1.35 support that was broken yesterday. All the haters looking to fade the breakdown are about to be shaken out by the pros as they cause the maket to move sideways and erratic until the path is clear to either drop further or reverse and start marching up. As the buyers of 1.35 panic and start buying more to average their already losing poisons.. I mean positions, or they sell to get out of their losers, they'll push the mRket down lower and the institutions will most likely be really happy to take the orders. I'd sit on the sideline until the LONDON session to watch for bids towards the broken support to clean up lingering orders and to see if they might want to save everybody some time and just drop the pair a hundred pips or so to cause a free-fall. None-the-less be attentive tomorrow as today wasn't easy or helpful like yesterday and we might see some action that could really shift the market. 

PS: AT THE END OF THE WEEK I'LL BE ANNOUNCING SOME AWESOME NEWS SO TUNE IN FOLKS!! 

Monday, July 21, 2014

Low Volatility= Swing Trades pt1: Before the Trade

In these times of low volatility and ranging markets in the Forex markets (outside of the recent GBP strength) we are presented with a great opportunity to create beautiful swing positions  in the some currency pairs! As some of us may know, volatility refers to the amount of uncertainty or risk about the size of changes in a security's value. A higher volatility means that a security's value can potentially be spread out over a larger range of values. This means that the price of the security can change dramatically over a short time period in either direction. A lower volatility means that a security's value does not fluctuate dramatically, but changes in value at a steady pace over a period of time. Thanks Investopedia lol. So basically swing positions need low volatility to perform optimally. This is because they depend on time market participants to cohesively move the instrument lower steadily as to not touch stop-loss orders and trailing stops. Dramatic price swings in volatile markets reach to touch these orders which upsets the entire position. 

PAIR AVAILABLE FOR SWING TRADE:

EUR/USD is the perfect pair to stalk for the next week or two because it's been loosing lots of volume and volatility moving towards it's 2014 low. As of now the pair is testing it's previous price of 1.35 which was most recently supported Friday (July 18) and before that June 5. Right now the pair's RSI on a daily chart shows bullish divergence from May 28th where price was 1.35864 and the RSI was at 27.1. Most recently (July 18th) the price has moved lower to 1.34903 with a higher RSI of 36.55!! This gives me the impression price wants to move higher but the pair isn't trading in that fashion which tells us to wait a bit. 

From 1.2744 the pair has seen a high of 1.39928 which is now the swing high.  The price 1.35 is around the 38.2% retracement of this swing while 1.33 is the nearest round price to the 50% retracement of this swing. With the 50% Fibonacci level being the most often tested price level along with the lack of upward momentum off 1.35, leads me to believe there's more room to the downside for this pair. 

The ATR is around 43 pips daily which we can say will lead us to our entry target at 1.33 by the end of the week or the beginning of next week. By the 28th of July the ascend towards 1.38 should begin. 
      1.38 is our most recent resistance  which was support for the upswing in April and May. Our first target should be reached by around August 11th or 12 days or so. Our next target of 1.400 (just above our swing high looking for new high) should be reached around 5 trading days later which would be around August 18th.
 
#  Beware of Wednesday July 30th as the US Fed. Bank announced it's fed fund rate. I think you know how important this is so try to already be locked into profits (at least +43 pip). By now price could be around 1.34 and if price retraces to 1.33 and holds I would look for an opportunity to increase my position size.
#  The next day to fear is Wednesday August 6 when the ECB announces it's EURO minimum bid rate which essentially the same as what the US fed bank will be doing in July. On this day you can look for a pull back to a previous resistance that may turn into a new support for another opportunity to increase your position size.  

With an entry of 1.33 we can safely set our stop/loss at 1.32 or -100 pips. From a 4-hour chart  view we can see the last downtrend from September 2013 was the next resistance level on the 4th and 5th which can now act as our 1.33 buy support on our way up this 2014 August. [That's almost perfect market symmetry, off by maybe 20 days lol.] Below 1.32 the next support we can assume is 1.28 which would disrupt any risk tolerant trades. From 1.33 to our target 1.40 we are pretending a 700 pip profit. From 1.33 to the next EXTREME support 1.28 we pretend to assume a 500 pip loss. Even if we took this trade our risk reward:ratio would be 1:1.4. Our trade isn't so risky as we are setting our stop/loss -100 pips away. That gives our trade a 1:7 risk:reward ratio, WITH confluence in indicators and price & volume. 

With respect to the law don't copy this idea lose money and try to blame it on me. If I trade this plan I'll make money because I know my strategies and plans. If you want to trade and make analysis like me let me know. And don't say I never gave you any ideas.  


PS: IM IN FLORIDA RIGHT NOW