Showing posts with label DOLLAR. Show all posts

Wednesday, October 8, 2014

Most Watched Stocks In The Market

This is an analysis on some of the most watched stocks in the U.S. Equity Markets today. You StockTwits kids should love this. I want you all to observe the gaps and trends which could make you a lot of money over the next few days: IF you trade them correctly.
To Start this report off we have SodaStream International Ltd. (SODA): Maker of the machine which gives consumers the ability to make their own soda at home.
From a technical perspective this stock is a bit unappealing other than the fact that it's in a downtrend. The gap that occurred after the weekend didn't excite me. That Just tells me that the market will be retracing soon to take those prices back and who knows when some hedge fund's limit order will be hit. I'd wait until price comes back towards the top of the gap around 27.50 for a short. From there I'd look for a target around 22.60 (bottom of the gap). Below Is a 15min chart which shows us The area which needs to be filled (in blue) and the consolidated trading from yesterday which rolled over into more falling today.

Next up we can take a look at Yum Brands Inc. (YUM) which is a beverage and fast food conglomerate. We see from the 60min chart below that this pair has been dominated by serious traders. Retail kids are getting crushed no doubt. It has ranged in a gap it created back in July of this year. It made some false breakouts and breakdowns the whole way through and currently the price has fallen out of the range.
The chart above gives us a chance to see the falling RSI which is an indicator that the price is ready for some rest. Now on a 15min chart we can see that this pair was seriously congested yesterday (highlighted in lighter blue) and today it whipped the shit out of the retail traders by making a dramatic spike and crashing back down severely. Around 71.15 is the bottom of the gap and the price has been rejected back below it today. That's the area you should be looking to short this stock. 

Let's move right along to Sunesis Pharmaceuticals (SNSS):
Another stock that has gaped down. This company has seen a horrible situation since Monday because it fell more than 50% in value since then. Around 3.85 is the closes resistance for this instrument and it doesn't look like it'll be back to it any time soon. On a 240min chart we can see the price fall heavily and the heavy selling since. 
On a 15min chart we can see the stocks daunting task of recovering towards any price of sustainability which is around 2.00 but it'll have to reach that then sky rocket nearly 100% just to get to the bottom of the gap its created(Highlighted in blue). 
Technically I'd sell all day.

Cree Inc. (CREE) is an LED manufacturer and makes semiconductor products for power and radio-frequency applications. This stock has a couple of gaps it needs to fill and I'm just waiting for the market to come along and sweep up every short trader's money when it does lol. The first gap runs back to August of this year when the price fell a little over $3/share to around 46.00. That gap was never filled. The second gap came recently around the 1st of this month when the price fell from around 39.50 to around 35.90. This gap was never filled either. The 60min chart below tells the story. 
To be honest I only see a sell from what seems to be near term resistance (33.40) but be cautious for the bounce that is to come. And when it comes don't be hard headed. Shoot for the gap fills, you know the markets will punish you for being a rogue trader and thinking trends last forever. The 15min chart below helps us see a more immediate opportunity. 
The first gap to be filled will be gap #2 where it'll probably range between its extremes then on to gap #1 where it'll most like go straight for the top of the gap. 

Last but not least we have Lakeland Industries Inc. (LAKE) who manufactures & sells safety garments & accessories. This stock has been fun recently. It has recently broken to important resistance levels and has risen well above its bullish trendline. The first resistance level was broken at around 8.00 and from there the price elevated to around 9.78 where it broke though yesterday and met some heavy resistance which we can observe from out 60min chart below.
 This gave me the idea to buy but then I kept going with my analysis. I observed that the reversal candle was a bit bearish and a bit engulfing lol. So then I considered the RSI...It was bearishly diverging from what the price was doing. On The 15min chart below we can see the divergence much clearer and we can also see the near term support we are testing today: If this doesn't hold I'm looking at a sell from around 9.83 back down to 9.00 then 8.00 if that doesn't hold. 

Friday, September 12, 2014

Mayweather With the Jab..

My USDJPY  and NZDUSD trades have paid me handsomely and I'm most likely going to close USDJPY and prepare for any profit taking next week for a new price to buy in at while taking my profits at their safest max. Below are pictures of the charts of these two pairs. They show, on the yellow dashed lines (Yellow Brick Road To the Emerald Palace of Profits), the price movement during my time in the trades. I see divergence and congestion in USDJPY yesterday & today. This trade has profited me over $11,000 on 500,000 lots.
NZDUSD on the other hand looks like it can stand another 2 days or week of selling. Especially with all the selling I'm seeing in AUDUSD which I closed earlier. This 60min chart shows a nice steady consistent downtrend with the RSI in correlation to the price movement. This trade has profited me over $9,000 on 500,000 lots.
Be sure to check out the TRADER TEES #freeMartoma and #freeSkilling for sale on my home page. This is a good end to a great week of trading.  

Wednesday, September 10, 2014

What to do with the Money?!?

It seems to me investors will be facing the interesting problem of finding places to put cash. Almost every central bank in the G20 is suffering from inflation deflation or just bad economic policy/management. Europe has done the craziest shit in the world and lowered their federal funds rate to a pointless level. If you're looking for a good place to open a savings account, certificate of deposit or money market account then I'd be looking at Australian Banks as we all know they have the highest federal funds rate of any other region in the world. In my opinion a good carry trade might be worth the effort to formulate. They offer volatility, guaranteed profits when correctly performed and a chance to take advantage of another region's awesome monetary benefits while stile holding on to your physical cash, keeping you liquid in other words.  
Another option is to buy some physical gold or silver; as I've written about before, I see some manipulation in the prices of these two metals that lead me to believe there is some accumulating of these metals by large sources of cash. In other words the big boys with all the money have gotten a head start on low metal prices with anticipation of a recovery from this year's tumble from a 20 year run-up. Large cash holders are trading in their dollars for tangible assets and by doing so they are suppressing the prices and making the transaction easier as a whole to complete. Ba smart investor and recognize that the price of Silver is low while the volumes in its trading has substantially risen over the same amount of time..Hmmm more trading and ranging prices...Do  I even have to say it? Do your job, make some money.
Or you could always just try your luck at buying the right stock at the right time and reversing the transaction perfectly to earn profits, lol.

I CAN'T BELIEVE I'M THIS LUCKY!!

OMG, I have to be the luckiest trader alive right now. So I was able to play the USDJPY breakout and it has essentially played out perfectly so far. On Friday, September 5, I bought 500,000 lots at 104.908 and haven't looked back since. The pair has been on a steady climb since the small retracement to weekly lows last Friday. Below is a figure of the hourly chart showing my entry level and this pairs progress.
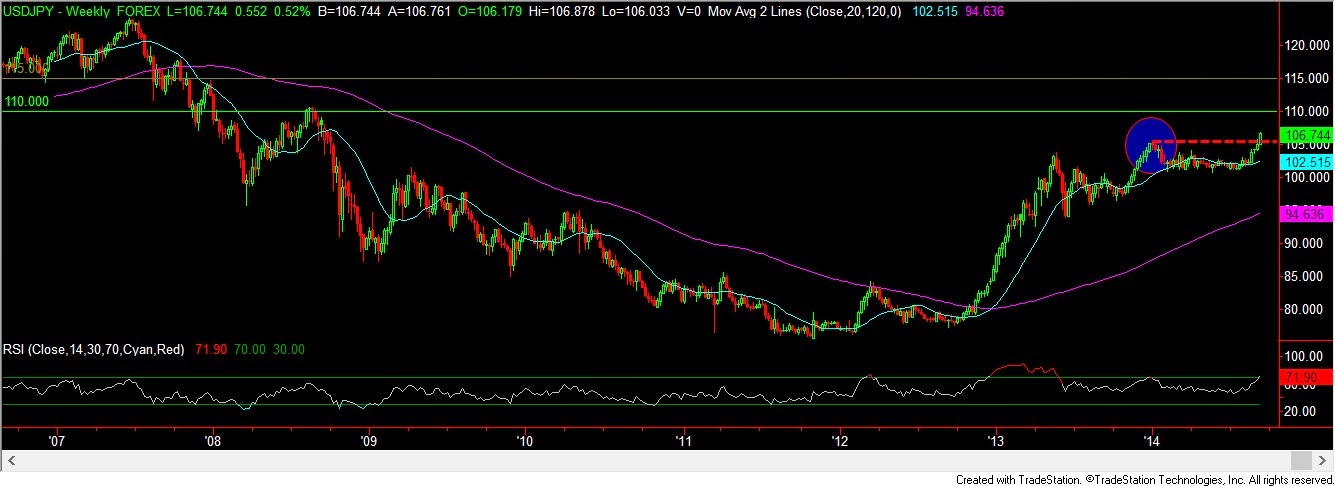
My targets are at 110.00 and 115.00. I'd love to sit here all day to explain but pictures say 1,000 words + ya'll aren't paying me yet so you have to connect the dots yourselves. lol. First I'll show you my view of this pairs weekly view to show you some relevant history.
 So I'm hoping the figure above helps you a bit. Next you should understand whats likely to play-out for USDJPY. Examine the figure below of this pair's monthly candlestick chart. To imagine what will come next simply turn the chart up-side down or flip it over.(lol). This might be confusing but you'll soon see, what comes around goes around.
Be prepared for the selling but don't forget about histroy's lesson to us. This pair has levels to meet as the chart above tells us...stay tuned.
So far this pair has already profited me over $9,000. 

Tuesday, September 2, 2014

GOING H.A.M.

So tonight I loaded up on orders because I've been on the sideline waiting for a few pairs to decide what they ultimately want and it seems as if they've made they're decisions. I'm not going to tell just what orders I've sent because I feel like we still have a lot to do to turn this EURUSD long trade into some profits. So far I've been shorting the pops in the pair but in between my large Lon position I've been building since price was around 1.33. As of tonight the price is around 1.313 just 20 pips away from our 1.315 support price and well into the support zone which bottoms out at 1.31. These levels represent a 61.8% retracement level from the 2014 highs. I'm bullish on this pair but it'll take some time before the price can support higher offers. The lower bids are drying up and daily candles are becoming doji designs for the retail traders to try and figure out.
For now I'm looking towards GBP, NZD, JPY and CAD for near term action with Canadian and Japanese monies capturing my preference for trading. Tomorrow iff one of my orders is taken, will I reveal all of the orders I placed today. 

Friday, July 25, 2014

Low-Volatility - Swing Trades Pt.1.5

So obviously I know what I'm talking about when it comes to his trading stuff because just like I said it would, the EURUSD has continued it's fall. Yesterday I warned you all about the dangerous doji candle and the weight of the market collapsed it like statistics said it should. Since it's Friday I would consider closing a portion of any sell positions if you can lock in profits. If you're waiting for the monster move to the upside just be patient and wait until next week for signals. 
Other than that enjoy your weekend folks and be sure to check the my blog www.tradingtheyen.com/blog 

Tuesday, July 22, 2014

Low Volatility- Swing Trades Pt.1.2

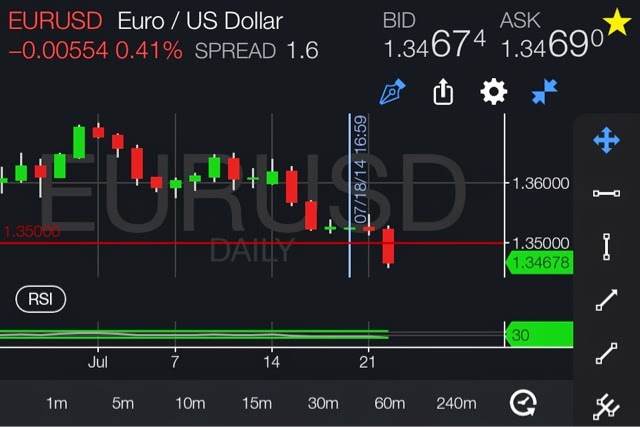
So the EUR/USD broke the 1.35 level today as I expected it to and as I wrote about yesterday. From here you can sell the pair down to the 1.33 level while watching for support buyers that can make the pair suddenly pop during the more volatile times of trade (US and LONDON sessions). This will provide you with trend riding trades all week until we reach our 1.33 entry at which we should stalk the price to confirm the support and watch the market makers shake out the amateurs trying to pick bottoms with the hopes of a sudden reverse; Which I might add is not likely to happen in 1 session or even 2. So stay tuned!!