OMG, I have to be the luckiest trader alive right now. So I was able to play the
USDJPY breakout and it has essentially played out perfectly so far. On Friday, September 5, I
bought 500,000 lots at
104.908 and haven't looked back since. The pair has been on a steady climb since the small retracement to weekly lows last Friday. Below is a figure of the hourly chart showing my entry level and this pairs progress.
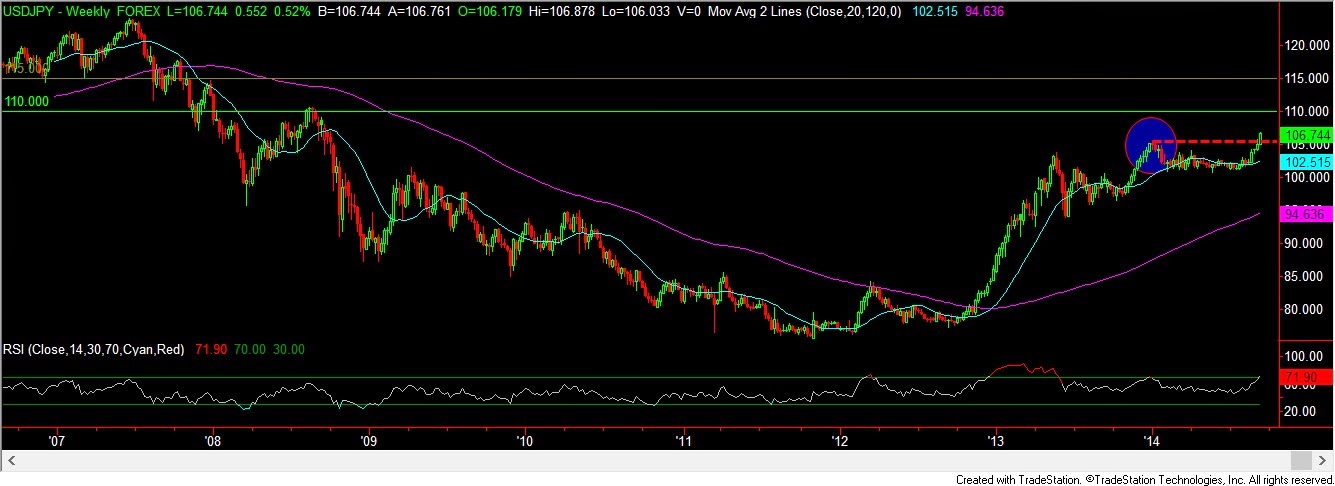
My targets are at 110.00 and 115.00. I'd love to sit here all day to explain but pictures say 1,000 words + ya'll aren't paying me yet so you have to connect the dots yourselves. lol. First I'll show you my view of this pairs weekly view to show you some relevant history.
So I'm hoping the figure above helps you a bit. Next you should understand whats likely to play-out for
USDJPY. Examine the figure below of this pair's monthly candlestick chart. To imagine what will come next simply turn the chart up-side down or flip it over.(lol). This might be confusing but you'll soon see, what comes around goes around.
Be prepared for the selling but don't forget about histroy's lesson to us. This pair has levels to meet as the chart above tells us...stay tuned.
So far this pair has already profited me over $9,000.


No comments:
Post a Comment