Showing posts with label income. Show all posts

Wednesday, April 1, 2015

Q1 Forex Trading Statement

this year has started off with a bang. I released my 2015 Forex Analysis which should answer lots of questions about my sentiment on the market and the trades I make. i finished the first quarter of this year with over 49% in profits and that's only for my Forex trading portfolio. Below are all my results and some charts from the positions I held. If you would like to invest in the fund or join me as an associate trader please feel free to reach out. The lord is happy to hear from you.

Here is my initial account information from the beginning of the quarter.
Annual Return

Monthly Return
Monthly Net Profit 
Monthly Accumulative Net Profit
Equity Curve 
Here are charts from some of the best trades from this quarter.


Monday, October 6, 2014

Coming Soon: For Those Who Are Serious About Trading

Coming Soon...

So it's Official Now! I'm happy to announce the Newest and Most Useful Trading Service On The Internet: Signal House is a full service signal service for Forex Traders and will be available to US. Equity Traders shortly after. The official web address will be www.tradesignalhouse.com . 

This website and service will be designed to help traders and investors make sound financial decisions based on a variety of Sell Side Analysis and reports, along with signals and alerts to help traders mitigate risk. 

Please Subscribe to this blog to stay updated on the progress of the site. Submit Your email at the top of the right side bar on any page of this blog! 
The services will be available to subscribers and will feature educational tools, trade signals & alerts, live trade webinars, trading videos, and post+pre trade reports & analysis. Hopefully it is a service you can use to optimize your portfolio and if you're a professional trader we welcome you to participate in our affiliates program. 

We look forward to the subscribers we attract and then seeing the growth of their portfolios using our services.

Thursday, October 2, 2014

The ECB Effect

So the ECB posted its rate announcement today and it was...to say the least; BORING. They didn't change anything actually but there was a reaction. Lets go over how the most relevant currency pairs reacted. Highlighted in blue is a two-day view of the pairs price along with its High and Low between the two days.
Has been falling steadily for over 30 days straight pretty much but yesterday it was pretty much congested and stuck in a range just before the end of the day when it consolidated; which is expected before news. What Most people didn't expect and what I predicted was the bounce in this pair. Contrary to the downtrend the market turned to the upside today. I know that banks and institutions use news for reasons to instigate sentiment and direction. This is what they did today. They sent the price all the way up to 1.26908 approx. 108 pips from yesterday's low of 1.25828. If we get a close above today's high/resistance(1.26650); we should see this pair turn to the upside for an extended period. The 60min chart below shows us what I'm talking about. Observe the RSI above 50 today... 
This pair has been on a downtrend as well but there is no rest for the weary when it comes to the Yen. Traders have been relentless in their pursuit to acquire yen for exchange for European Currencies. Monetary policies have created this atmosphere. Yesterdays high was met by a shooting start at 138.799. Towards the end of the day yesterday we saw our support of 138.00 broken, the pair slid into the London Session saw a new low of 136.947 and the price became congested around the time of the ECB Rate News; Leading me to believe the bank traders were simply trying to confuse the retail markets as well as get customer orders in before the price got away from them. Below on a 60min chart we can observe this behavior. 
So yesterday this pair fell but managed to pick itself up during the Asian Session and end the day just barely higher than it opened. Today was a completely different story. I wasn't sure when but I know there would be a bounce in this pair and boy oh boy did it bounce today. I knew this because of the consolidation without range I noticed on the 60min chart. Below on that same chart we can see the pair test a low of .77660 yesterday AND the day before that without breaking down. From there the pair used the new to bolster itself up to a high of .78497; passed the .78277 intra-week resistance. I see the tide turning for this pair and more positive days in its future. Below we can observe the RSI moving from below 50 to overbought in just 48 hours. Interesting. 
The Australian traders are giving the markets hell right now (lol). If you don't know anything about the Aussie traders and pairs I'll give you a bit of advice: Be early, because they move fast and often. This pair took a nice ladder up over the past few weeks and ended up going haywire in a realm of congestion just as it met new highs. Yesterday the pair failed to make a higher high (1.45609) and ended up falling dramatically. It ended the yesterday near its opening price and  roamed into today falling below its medium term support (1.44500) which looks like it could now serve a resistance. Today it has successfully made a lower low at 1.43447 and has began to retrace towards the aforementioned resistance test. Below we can observe the pair's RSI just above 50 but that seems to be the signal for the bears to come in and take control. 


A Weekend Out In Pittsburgh

Over the weekend I had the time and chance to go to Pittsburgh, Pa. simply because I wanted to. I actually like the city a lot. It has a completely different vibe to it than the other Pennsylvanian cities I visit.
Unlike Philadelphia, "The Burgh" is much quieter and slower than the fast paced business oriented Philly streets. While I was in Pittsburgh I had the chance to explore their parks, people, and food!
Being from Texas, I'm really big on visiting places with friendly people and I must say; The People in Pittsburgh are AWESOME. They're super friendly and the city is so clean...compared to the rest of the major cities in the state (lol). Although it isn't the most diverse city it does have a great deal of character and  culture. I recognized a great Italian presence and Polish as well!! Black people, we're everywhere so I wasn't surprised to see us but I was surprised at how well the city has integrated. It may not be a Utopian society but the people there surely do share a lot of space and it seemed acceptable. The people seemed to have created an atmosphere of cohesion.


Aside from the people I was amazed at the landscape of the city; The skyscrapers aren't numerous but their designs are really unique and cool. Seeing as how the city is known for its 3 rivers and bridges I think its only right that they don't cloud the aerial views with buildings. Speaking of rivers and bridges, the city is divided by these structures and creates an interesting traffic flow where commuters must wind their way through hills, mountain sides, down through valleys & troughs only to arrive at bridges that reach over sprawling rivers which seem endless in the horizon. The sunset is truly beautiful.

Monday, September 29, 2014

High-Pay Stocks For Busy People

Last week was a great week in the FOREX market, but I like to reach across all markets so this week I'm looking at a few stocks that show some good potential to move. To be honest I'm not really into day trading stocks because for some reason the stock market actually believes in fundamental analysis. Don't get me wrong, I'm not saying the analysis of opinions and events isn't worth a damn, I'm just saying I prefer to trade markets where their effects aren't so dramatic.
To start this thing off I want to bring attention to a previous employer of mine which took a 26 year vacation from the public trading floors only to return with a vengeance, Citizens Financial Group (CFG) went public last week and they did so in style!! Although there isn't much technical analysis to do on this instrument its charts still tell a good story and show signs of healthy growth in its future. Below is a 5min chart which shows us the Royal Bank Of Scotland (RBS) owned Retail bank took off from its Initial Public Offering (IPO) price ($21.50) and has't turned back since. I'm looking to get into this value priced stock before the price becomes too pricey!
Next up we have Alibaba (BABA) which has surprised US investors by taking a turn to the downside after a decent IPO. The Price has been suppressed and congested since its heavy decline the day after its IPO. But to be fair the stock is showing some interesting behavior on its 15min chart which has just now become useful because of the instruments infancy. From the chart we can see an obvious wedge which favors the upside, only because the recent lows have been getting higher and highs are testing intra-day resistance levels. A break above the upper boundaries sends us to test its opening price and in case of a break below lower boundaries we will see a test of the all-time low at $86.62.
Now I've talked about MCIG before when I wrote about which Weed Stocks were worth looking into. We see from the daily chart of this company's stock that it has suffered from some serious distribution which has taken its price below its long standing support of .2604. We now see the stock attempting to rebound but it looks like this is only a play towards the old support which will most likely be turned to resistance. I would buy this pair until a true floor has been designed on a daily chart. For now a sell from the aforementioned resistance will do.
Now not too long ago someone on StockTwits (@joekidd) called me out on my Citigroup (C) prediction. I saw a short opportunity and this guy didn't think it could be true but today I want everyone to observe a false breakout which is one of my favorite events to take place because I usually walk away with such easy money. This stock has done a typical run up out of its range only to collapse back down into it and then move towards its bottom end nearly touching my profit target at $51.10. If you want to play the game the right way, buy at the bottom of this range...trust the lord of trading. Don't be like the kid joe.
AMAG has completely disrespected my initial set-up so now I say, buy it. The 60min chart shows us that this stock clearly has some supporters and they wanted the price completely out of its range and today it gaped up over $3 higher than its close on Friday $23.08. Jump in at the previous high $24.87 which should turn to support.
So if you're looking for some stock you can earn from without having to babysit your account all day than I would consider all of these stocks. They aren't too expensive and the offer enough volatility to make money quickly but not too much volatility that its impossible to set and forget which is always the goal. 


Wednesday, September 10, 2014

Cheers to my Hooligans in London

Looks like my boys(and girls) out in London are done taking profits from this years buying frenzy. GBPUSD looks to be a little exhausted from all its recent selling. Yesterday the pair posted a measly doji candle  at what seems to be the bottom of a  2 month correction/ sell-off. Coincidentally this level is just above 1.600 OR the 50% retracement level of the initial move upward that started in 2013. As of now the price is at a yearly low of 1.62030 but looks to be setting a reversal in motion. After the doji posted yesterday September 9, GBPUSD closed at 1.61051; today the pair showed some strong support and took the price soaring to 1.62295, some 124.4pips!! In the figure below you can see the recent moves and important price levels to watch in the near future.
I'd be looking to build my buy around these low levels in anticipation of a reversal in the near future. My confirmation will be the 1.64 support on the way down turning into broken resistance on the way up. As for now we wait.  

I CAN'T BELIEVE I'M THIS LUCKY!!

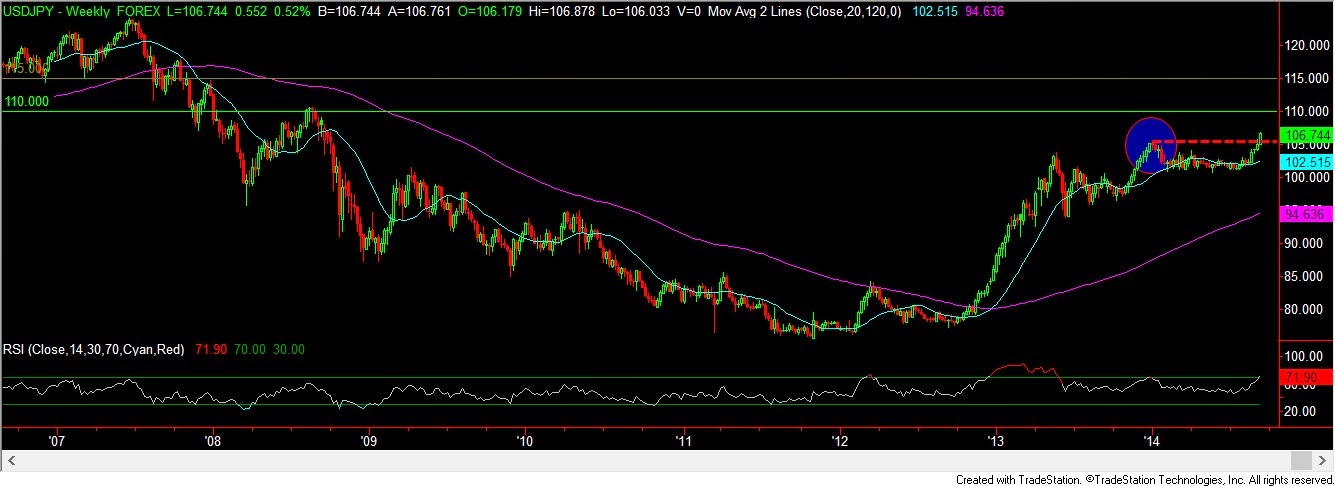
OMG, I have to be the luckiest trader alive right now. So I was able to play the USDJPY breakout and it has essentially played out perfectly so far. On Friday, September 5, I bought 500,000 lots at 104.908 and haven't looked back since. The pair has been on a steady climb since the small retracement to weekly lows last Friday. Below is a figure of the hourly chart showing my entry level and this pairs progress.
My targets are at 110.00 and 115.00. I'd love to sit here all day to explain but pictures say 1,000 words + ya'll aren't paying me yet so you have to connect the dots yourselves. lol. First I'll show you my view of this pairs weekly view to show you some relevant history.
 So I'm hoping the figure above helps you a bit. Next you should understand whats likely to play-out for USDJPY. Examine the figure below of this pair's monthly candlestick chart. To imagine what will come next simply turn the chart up-side down or flip it over.(lol). This might be confusing but you'll soon see, what comes around goes around.
Be prepared for the selling but don't forget about histroy's lesson to us. This pair has levels to meet as the chart above tells us...stay tuned.
So far this pair has already profited me over $9,000. 

Tuesday, September 2, 2014

GOING H.A.M.

So tonight I loaded up on orders because I've been on the sideline waiting for a few pairs to decide what they ultimately want and it seems as if they've made they're decisions. I'm not going to tell just what orders I've sent because I feel like we still have a lot to do to turn this EURUSD long trade into some profits. So far I've been shorting the pops in the pair but in between my large Lon position I've been building since price was around 1.33. As of tonight the price is around 1.313 just 20 pips away from our 1.315 support price and well into the support zone which bottoms out at 1.31. These levels represent a 61.8% retracement level from the 2014 highs. I'm bullish on this pair but it'll take some time before the price can support higher offers. The lower bids are drying up and daily candles are becoming doji designs for the retail traders to try and figure out.
For now I'm looking towards GBP, NZD, JPY and CAD for near term action with Canadian and Japanese monies capturing my preference for trading. Tomorrow iff one of my orders is taken, will I reveal all of the orders I placed today. 

Monday, June 16, 2014

Dividend stock advisor

So I'm working on a portfolio that features some dividend yielding stocks in order to generate some residual income for my clients and myself. I wanted to share a few key factors which help decide on which stocks to buy. 
LOOK FOR:
•Stocks that earn 2x as much as they pay out in dividends
•Good balance sheet
•Consistently raise dividends decade after decade 

AVOID:
•Stocks yielding 10% (Obviously because interest rates are 2%)
• Earnings that don't cover dividends.

If you're interested in learning more about dividends investing or about the portfolios I build and manage please feel free to email me.