Showing posts with label portfolio. Show all posts

Thursday, February 5, 2015

2015 Top Portfolio Picks

2015 will be another year full of investing opportunities for all. In this article I would like to take a look at 5 different assets and how they might perform in 2015. Not only are these instruments poised for major gains but they offer a unique chance to enter markets that have previously been high priced and hard to get into. Some of these instruments weren't even available just 5 years ago.

DEBT - Fannie Mae (FNMA):
This stock has been in a range since October 2014 and the range keeps getting tighter and tighter. The consolidation tells me that the market is ready to send this stock in one direction or another. Based on a 240 min chart we can see that the pressure has been to the downside overall but twisting moving averages give insight into the sentiment of the market for this stock. Let's remember that this stock is trading between 1.9855 and 2.5457.
 The next move for this stock would be to sell heavy it breaches the range low 1.9855 and closes below it. If the market decides it has faith in this stock then we should see the price break above 2.5457 and use that price as support. If that happens I would look for a buy into the 4.000 zone.

METALS - Goldcorp Inc. (GG):
This year is the best in years to invest in precious metals. I've written about the opportunity in metals recently and I also have a Crowdfunding Campaign which looks to receive contributions towards a bullion investment. Read more about that on my campaign site. This company is one of the best miners of the precious metal and it could make a meaningful recovery this year. On a weekly chart this stock has made a slight double bottom and the price is currently above an important moving average.
The best entry would be near its most recent low 16.00 with a stop-loss limit at 13.84 which is its all-time low. Our profit zone is between 31.40 and 32.80 (around the 38.2% fib level from the 2011 highs to the 2015 lows) Our second profit target is between 40.00 and 40.91 (nearly the 61.8% fib level) 

This stock looks particularly interesting. On a weekly chart we see a well established bullish divergence from the price of the stock to the RSI indicator.
At the same time I noticed a potential Gartley Pattern which leads me to believe a large upswing could be in the making. 
This pattern led to the formation of the strategy I developed to trade this stock. We know that this type of pattern leads to bullish momentum. We can clearly see our moving averages looping around one another and that tells us that the market may be a bit confused about how it feels towards the stock.
A 240min chart was required to find good entries and targets. 11.00 is where support has been found so that's our entry price. Our stop-loss limit is between 10.35 and 10.38 which is our 23.6 fib level and next support level. Our profit target is between 13.00 and 13.20 (Nearly the 61.8% fib level.)

This particular instrument is an ETN. This index looks to provide the returns that are in an investment in the futures contracts on the commodity of sugar. This product also includes the rate of interest from collateral invested in Treasury Bills. If you didn't get what I just said let me break it down for you. Basically the Exchange Traded Note is a derivative of the sugar index contingent upon futures contracts as well as reflects the rate of interest that could be earned on cash collateral invested in specific Treasury Bills. 
Trading at all-time lows this ETN and a FRB looking to raise interest rates, this instrument is poised for a jump in value as well as a bump up in the cash returns earned on its investments in Treasury Bills. We also know that the US has loosened its trading embargo on Cuba who sells nearly $447 million worth of raw sugar annually. Buy at any price and your target could be $50 interestingly just at its most recent support that was broken.

A weekly chart reveals that this stock has suffered a strong sell-off towards the end of 2014 and could be ready for more selling as moving averages trade places, signaling weakness in the markets sentiment. All that coupled with the coming infusion of cash from Shell's deal to sell its Brent Crude Operations spell out "BUY ME". 
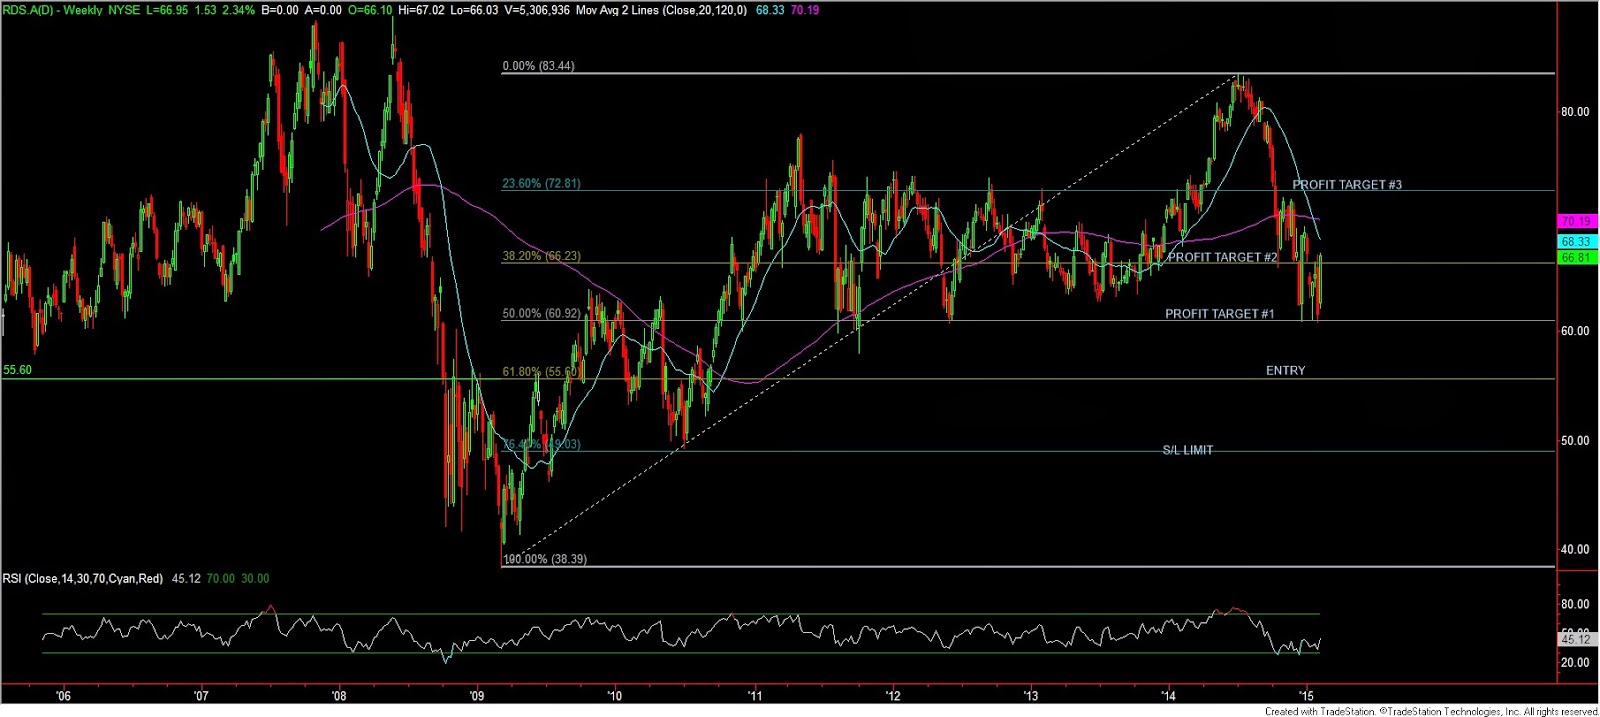
The 61.8% fib level, $55.60, looks like the best entry price to buy this stock as it is the price action area which has served as a pivot for bulls and bears. Our stop-loss could be set to 49.03 which is also our 76.4% fib level and just below our 2010 low. Our profit targets are spread out over 3 prices. First is 60.92 which is also our 50% fib level and recent support which could act as resistance on the way back up. Number 2 is 66.23 also our 38.2% fib level and a serious price action zone. Last is $72.81 which coincidentally is our 23.6% fib level and a historically major resistance price from 2011, 2012 and 2013.

Friday, October 10, 2014

The Fate Of The USD

So as we all know the FOMC will be meeting again to announce their almighty important notes and we traders need to be on out toes. I want to take the time to go over some of the most important currency pairs during these hours of waiting. In This report we'll cover the most traded USD pairs available, EURUSD GBPUSD, USDCAD, USDJPY, and AUDUSD.
GBPUSD: This pair has taken a turn towards the stars and looks like it could be reversing its current downtrend. Since July this pair has been steadily drifting lower and lower and reached a yearly low of 1.60000 which acted as support for some congested trading going back to...get this...October of last year...and also the 50% Fibonacci retracement price. On the daily chart below we can see the confluence in color.
After the first test of the low the pair sprang back up to 1.64000 where it was rejected and once again fell to and then below 1.60000 before is was pressed back up to 1.61585. On the hourly chart below we can get a closer look at how this pair has been performing with this weeks movements highlighted in blue. From 1.60000 the pair took a steady path up and actually rose above its resistance before it was pressed back below it. This tells me that the traders want prices above this and their only preparing the situation strategically; so should you. 
I would be looking to sell this pair from 1.61585 and buy it at 1.60000 keeping a close eye on it just in case the banks want to take the price a step lower to the 61.8% Fibonacci at 1.57000, another great place to buy. 

EURUSD: This Pair looks like a little more fun. It has taken its drop step by step, almost in perfect lock step formation as far as the 240min chart shows. We can see from the chart below that this pair has found some good support around 1.25500. From There it has been on a consistent march back up towards the 61.8% Fibonacci level it broke about a week and a half ago. It was rejected back down from there and ended up being supported just at 1.26650 which also acted as resistance on the way down. It's good to see the bank traders are respecting technical levels. 
I'd be looking to buy this pair from or near 1.26650 with some bias to the downside so watch your position with caution as this pair has been known to be hella volatile. 

USDCAD: Is a completely different beast. This pair has seen some serious congestion where traders are sending the price flying and falling all within 1 or 2 sessions. On a 60min chart we can observe that this pair is still being supported by its original up trend support line but it does look to be losing some steam as far as the bulls are concerned. Around 1.11600 would be the level I'd sell from IF I was going to make any trade. I don't see much more upside potential in this pair and I don't think the banks are ready to lower it out of its uptrend just yet (think manipulation) 
AUDUSD: Is another pair which looks to be turning its tides from being a seller to being a buyer. Over the past week we've seen the price hit its most recent lows only to pick up Monday with nothing but buyer behind it. Though this pair has been seriously volatile we can clearly see its upswing and potential for more bullish moves. Price us testing near term support around .87500 where we could see the price bounce and continue its uptrend. I want to see .88800 cleared before I step in for a buy only because of this pair history of volatility especially during odd hours. 
 And last but not least,

USDJPY: This pair reached awesome new highs and then....nothing. It's been so lackluster I wouldn't even suggest a trade if you're not already in a successful position already. If you are in a position I hope it's a long position and I would only suggest buying more while you have a chance before the hike towards 115.000 which probably won't take long considering all the stalling that's going on in the pair now. Below on a 60min chart we can see the consolidated trading of this pair. 

Monday, July 21, 2014

Low Volatility= Swing Trades pt1: Before the Trade

In these times of low volatility and ranging markets in the Forex markets (outside of the recent GBP strength) we are presented with a great opportunity to create beautiful swing positions  in the some currency pairs! As some of us may know, volatility refers to the amount of uncertainty or risk about the size of changes in a security's value. A higher volatility means that a security's value can potentially be spread out over a larger range of values. This means that the price of the security can change dramatically over a short time period in either direction. A lower volatility means that a security's value does not fluctuate dramatically, but changes in value at a steady pace over a period of time. Thanks Investopedia lol. So basically swing positions need low volatility to perform optimally. This is because they depend on time market participants to cohesively move the instrument lower steadily as to not touch stop-loss orders and trailing stops. Dramatic price swings in volatile markets reach to touch these orders which upsets the entire position. 

PAIR AVAILABLE FOR SWING TRADE:

EUR/USD is the perfect pair to stalk for the next week or two because it's been loosing lots of volume and volatility moving towards it's 2014 low. As of now the pair is testing it's previous price of 1.35 which was most recently supported Friday (July 18) and before that June 5. Right now the pair's RSI on a daily chart shows bullish divergence from May 28th where price was 1.35864 and the RSI was at 27.1. Most recently (July 18th) the price has moved lower to 1.34903 with a higher RSI of 36.55!! This gives me the impression price wants to move higher but the pair isn't trading in that fashion which tells us to wait a bit. 

From 1.2744 the pair has seen a high of 1.39928 which is now the swing high.  The price 1.35 is around the 38.2% retracement of this swing while 1.33 is the nearest round price to the 50% retracement of this swing. With the 50% Fibonacci level being the most often tested price level along with the lack of upward momentum off 1.35, leads me to believe there's more room to the downside for this pair. 

The ATR is around 43 pips daily which we can say will lead us to our entry target at 1.33 by the end of the week or the beginning of next week. By the 28th of July the ascend towards 1.38 should begin. 
      1.38 is our most recent resistance  which was support for the upswing in April and May. Our first target should be reached by around August 11th or 12 days or so. Our next target of 1.400 (just above our swing high looking for new high) should be reached around 5 trading days later which would be around August 18th.
 
#  Beware of Wednesday July 30th as the US Fed. Bank announced it's fed fund rate. I think you know how important this is so try to already be locked into profits (at least +43 pip). By now price could be around 1.34 and if price retraces to 1.33 and holds I would look for an opportunity to increase my position size.
#  The next day to fear is Wednesday August 6 when the ECB announces it's EURO minimum bid rate which essentially the same as what the US fed bank will be doing in July. On this day you can look for a pull back to a previous resistance that may turn into a new support for another opportunity to increase your position size.  

With an entry of 1.33 we can safely set our stop/loss at 1.32 or -100 pips. From a 4-hour chart  view we can see the last downtrend from September 2013 was the next resistance level on the 4th and 5th which can now act as our 1.33 buy support on our way up this 2014 August. [That's almost perfect market symmetry, off by maybe 20 days lol.] Below 1.32 the next support we can assume is 1.28 which would disrupt any risk tolerant trades. From 1.33 to our target 1.40 we are pretending a 700 pip profit. From 1.33 to the next EXTREME support 1.28 we pretend to assume a 500 pip loss. Even if we took this trade our risk reward:ratio would be 1:1.4. Our trade isn't so risky as we are setting our stop/loss -100 pips away. That gives our trade a 1:7 risk:reward ratio, WITH confluence in indicators and price & volume. 

With respect to the law don't copy this idea lose money and try to blame it on me. If I trade this plan I'll make money because I know my strategies and plans. If you want to trade and make analysis like me let me know. And don't say I never gave you any ideas.  


PS: IM IN FLORIDA RIGHT NOW
 

Monday, June 16, 2014

Dividend stock advisor

So I'm working on a portfolio that features some dividend yielding stocks in order to generate some residual income for my clients and myself. I wanted to share a few key factors which help decide on which stocks to buy. 
LOOK FOR:
•Stocks that earn 2x as much as they pay out in dividends
•Good balance sheet
•Consistently raise dividends decade after decade 

AVOID:
•Stocks yielding 10% (Obviously because interest rates are 2%)
• Earnings that don't cover dividends.

If you're interested in learning more about dividends investing or about the portfolios I build and manage please feel free to email me.