DEBT - Fannie Mae (FNMA):
This stock has been in a range since October 2014 and the range keeps getting tighter and tighter. The consolidation tells me that the market is ready to send this stock in one direction or another. Based on a 240 min chart we can see that the pressure has been to the downside overall but twisting moving averages give insight into the sentiment of the market for this stock. Let's remember that this stock is trading between 1.9855 and 2.5457.
The next move for this stock would be to sell heavy it breaches the range low 1.9855 and closes below it. If the market decides it has faith in this stock then we should see the price break above 2.5457 and use that price as support. If that happens I would look for a buy into the 4.000 zone.
METALS - Goldcorp Inc. (GG):
This year is the best in years to invest in precious metals. I've written about the opportunity in metals recently and I also have a Crowdfunding Campaign which looks to receive contributions towards a bullion investment. Read more about that on my campaign site. This company is one of the best miners of the precious metal and it could make a meaningful recovery this year. On a weekly chart this stock has made a slight double bottom and the price is currently above an important moving average.
The best entry would be near its most recent low 16.00 with a stop-loss limit at 13.84 which is its all-time low. Our profit zone is between 31.40 and 32.80 (around the 38.2% fib level from the 2011 highs to the 2015 lows) Our second profit target is between 40.00 and 40.91 (nearly the 61.8% fib level)
This stock looks particularly interesting. On a weekly chart we see a well established bullish divergence from the price of the stock to the RSI indicator.
At the same time I noticed a potential Gartley Pattern which leads me to believe a large upswing could be in the making.
This pattern led to the formation of the strategy I developed to trade this stock. We know that this type of pattern leads to bullish momentum. We can clearly see our moving averages looping around one another and that tells us that the market may be a bit confused about how it feels towards the stock.
A 240min chart was required to find good entries and targets. 11.00 is where support has been found so that's our entry price. Our stop-loss limit is between 10.35 and 10.38 which is our 23.6 fib level and next support level. Our profit target is between 13.00 and 13.20 (Nearly the 61.8% fib level.)
This particular instrument is an ETN. This index looks to provide the returns that are in an investment in the futures contracts on the commodity of sugar. This product also includes the rate of interest from collateral invested in Treasury Bills. If you didn't get what I just said let me break it down for you. Basically the Exchange Traded Note is a derivative of the sugar index contingent upon futures contracts as well as reflects the rate of interest that could be earned on cash collateral invested in specific Treasury Bills.
Trading at all-time lows this ETN and a FRB looking to raise interest rates, this instrument is poised for a jump in value as well as a bump up in the cash returns earned on its investments in Treasury Bills. We also know that the US has loosened its trading embargo on Cuba who sells nearly $447 million worth of raw sugar annually. Buy at any price and your target could be $50 interestingly just at its most recent support that was broken.
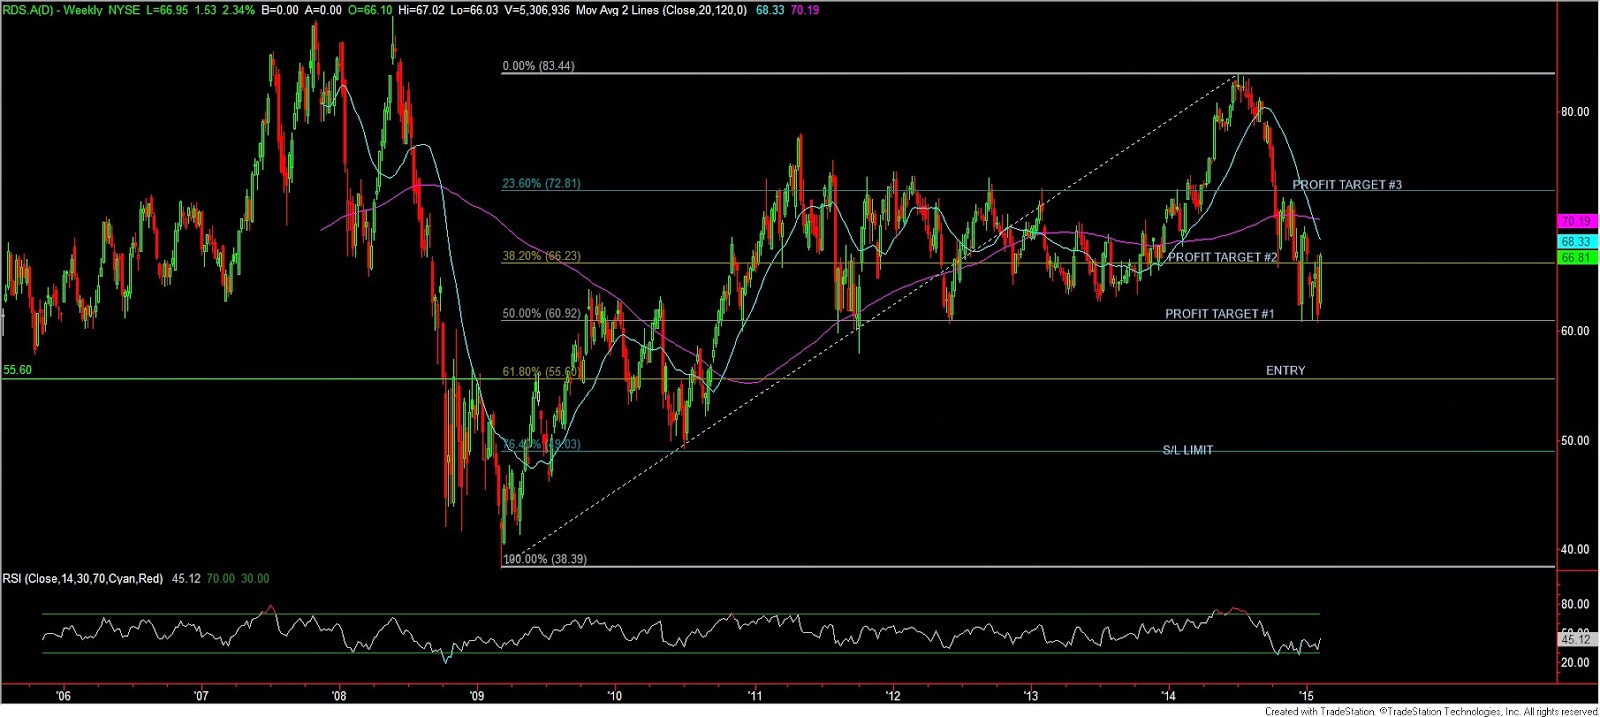
A weekly chart reveals that this stock has suffered a strong sell-off towards the end of 2014 and could be ready for more selling as moving averages trade places, signaling weakness in the markets sentiment. All that coupled with the coming infusion of cash from Shell's deal to sell its Brent Crude Operations spell out "BUY ME".
The 61.8% fib level, $55.60, looks like the best entry price to buy this stock as it is the price action area which has served as a pivot for bulls and bears. Our stop-loss could be set to 49.03 which is also our 76.4% fib level and just below our 2010 low. Our profit targets are spread out over 3 prices. First is 60.92 which is also our 50% fib level and recent support which could act as resistance on the way back up. Number 2 is 66.23 also our 38.2% fib level and a serious price action zone. Last is $72.81 which coincidentally is our 23.6% fib level and a historically major resistance price from 2011, 2012 and 2013.


No comments:
Post a Comment