Showing posts with label investing. Show all posts

Monday, April 13, 2015

2015 Quarter 2 FOREX Outlook

Looks like Q1 went just as I planned it would. I took the time to highlight some of the highest growth potential pairs in the FOREX markets. Quarter 2 of this year looks like it has some big plays for traders and investors alike. In this article we will explore some of those opportunities.

First let's look back at the top 3 major pairs over the past three months.
USD:
The dollar rose significantly against every pair except the Swiss Franc. Some potential pairs to trade that stood out to me were EURUSD, USDJPY, and GBPUSD. To be more specific, I have set a target for selling the EURUSD into .97000.
I have set a 122.000 target for USDJPY and a GBPUSD target of 1.42300 to sell into.
GBP:
The pound had a rough time carving out any significant gains or losses due to a mix of sell-offs and rallies between all of the major crosses. GBPJPY has been stuck in a range between 185.000 and 175.000 which makes me weary of engaging in any trades with this pair. If I do it will be within the range or for a breakout above 185.000. GBPCHF sold off heavily and rallied to fill the gap only to turn back around and tick back down towards the middle of the gap.
GBPUSD should continue lower into my target of 1.42300. Along with this we have GBPNZD which I have set a target range of 1.94 and 1.92 for traders to sell into.

EUR:
The EURO was the at the butt of everyone's trades. This currency was sold off more than any other pair in the major currency markets. Above is an illustration of EURGBP which was sold off very heavily in the first quarter. I see this selling continuing and I've set a target of .7000 but not before the market retraces a bit into .75000 and then sending the pair lower. Again I put emphasis on a EURUSD .97000 target. EURJPY will be falling a little more this quarter and I have set a target of 120.000 for the pair seeing as how the JPY needs some relief from being sold by all the other major crosses. 

Wednesday, April 1, 2015

Q1 Stock Portfolio Review

I had an awesome quarter in my Forex portfolio returning over 49% in just the first 90 days of the year. A good investor and trader doesn't have to limit their self to trapping out of just one market. I also use my talents to trade and invest in the U.S. Equity Markets which has been good so far. In this post I will outline some of my trades and show charts to illustrate the plan for the investments. This portfolio does have a different strategy than my Forex portfolio but I use the same competencies to accomplish beta. Although my strategies are different the results are the same; I make money.

My Watch-list included:
SPWR
FGP-filled - $23.61
BBY--->SWITCHED to BBRY- filled - $9.33
AAPL
DOX
JPM-filled - $59.87
C
GS
ADK-filled - $4.28
ALXN-filled - $180.87
ZMH-filled - $119.72
BMRN
Not all of my entries have been filled so there is no information on the results of these stocks in my portfolio. 
About half of my portfolio is active so far and it seems to moving along fine. Through the ups and downs the swings have been bearable and the entries look like good support levels. 
The key to managing a portfolio to beta is to rely on diligent research and master patience. There were days when a particular stock would be only pennies away from my entry target but one must exert true self-control and wait for the planned opportunity or better. When I enter a trade I am sure this where I want to be and I know what I will do if prices move to place I do not want to be. 

Here are charts displaying some of the positions the portfolio is currently holding.


IF YOU'RE INTERESTED IN INVESTING IN THE FUND OR BECOMING AN ASSOCIATE TRADER FEEL FREE TO REACH-OUT TO ME. 

Thursday, February 5, 2015

2015 Top Portfolio Picks

2015 will be another year full of investing opportunities for all. In this article I would like to take a look at 5 different assets and how they might perform in 2015. Not only are these instruments poised for major gains but they offer a unique chance to enter markets that have previously been high priced and hard to get into. Some of these instruments weren't even available just 5 years ago.

DEBT - Fannie Mae (FNMA):
This stock has been in a range since October 2014 and the range keeps getting tighter and tighter. The consolidation tells me that the market is ready to send this stock in one direction or another. Based on a 240 min chart we can see that the pressure has been to the downside overall but twisting moving averages give insight into the sentiment of the market for this stock. Let's remember that this stock is trading between 1.9855 and 2.5457.
 The next move for this stock would be to sell heavy it breaches the range low 1.9855 and closes below it. If the market decides it has faith in this stock then we should see the price break above 2.5457 and use that price as support. If that happens I would look for a buy into the 4.000 zone.

METALS - Goldcorp Inc. (GG):
This year is the best in years to invest in precious metals. I've written about the opportunity in metals recently and I also have a Crowdfunding Campaign which looks to receive contributions towards a bullion investment. Read more about that on my campaign site. This company is one of the best miners of the precious metal and it could make a meaningful recovery this year. On a weekly chart this stock has made a slight double bottom and the price is currently above an important moving average.
The best entry would be near its most recent low 16.00 with a stop-loss limit at 13.84 which is its all-time low. Our profit zone is between 31.40 and 32.80 (around the 38.2% fib level from the 2011 highs to the 2015 lows) Our second profit target is between 40.00 and 40.91 (nearly the 61.8% fib level) 

This stock looks particularly interesting. On a weekly chart we see a well established bullish divergence from the price of the stock to the RSI indicator.
At the same time I noticed a potential Gartley Pattern which leads me to believe a large upswing could be in the making. 
This pattern led to the formation of the strategy I developed to trade this stock. We know that this type of pattern leads to bullish momentum. We can clearly see our moving averages looping around one another and that tells us that the market may be a bit confused about how it feels towards the stock.
A 240min chart was required to find good entries and targets. 11.00 is where support has been found so that's our entry price. Our stop-loss limit is between 10.35 and 10.38 which is our 23.6 fib level and next support level. Our profit target is between 13.00 and 13.20 (Nearly the 61.8% fib level.)

This particular instrument is an ETN. This index looks to provide the returns that are in an investment in the futures contracts on the commodity of sugar. This product also includes the rate of interest from collateral invested in Treasury Bills. If you didn't get what I just said let me break it down for you. Basically the Exchange Traded Note is a derivative of the sugar index contingent upon futures contracts as well as reflects the rate of interest that could be earned on cash collateral invested in specific Treasury Bills. 
Trading at all-time lows this ETN and a FRB looking to raise interest rates, this instrument is poised for a jump in value as well as a bump up in the cash returns earned on its investments in Treasury Bills. We also know that the US has loosened its trading embargo on Cuba who sells nearly $447 million worth of raw sugar annually. Buy at any price and your target could be $50 interestingly just at its most recent support that was broken.

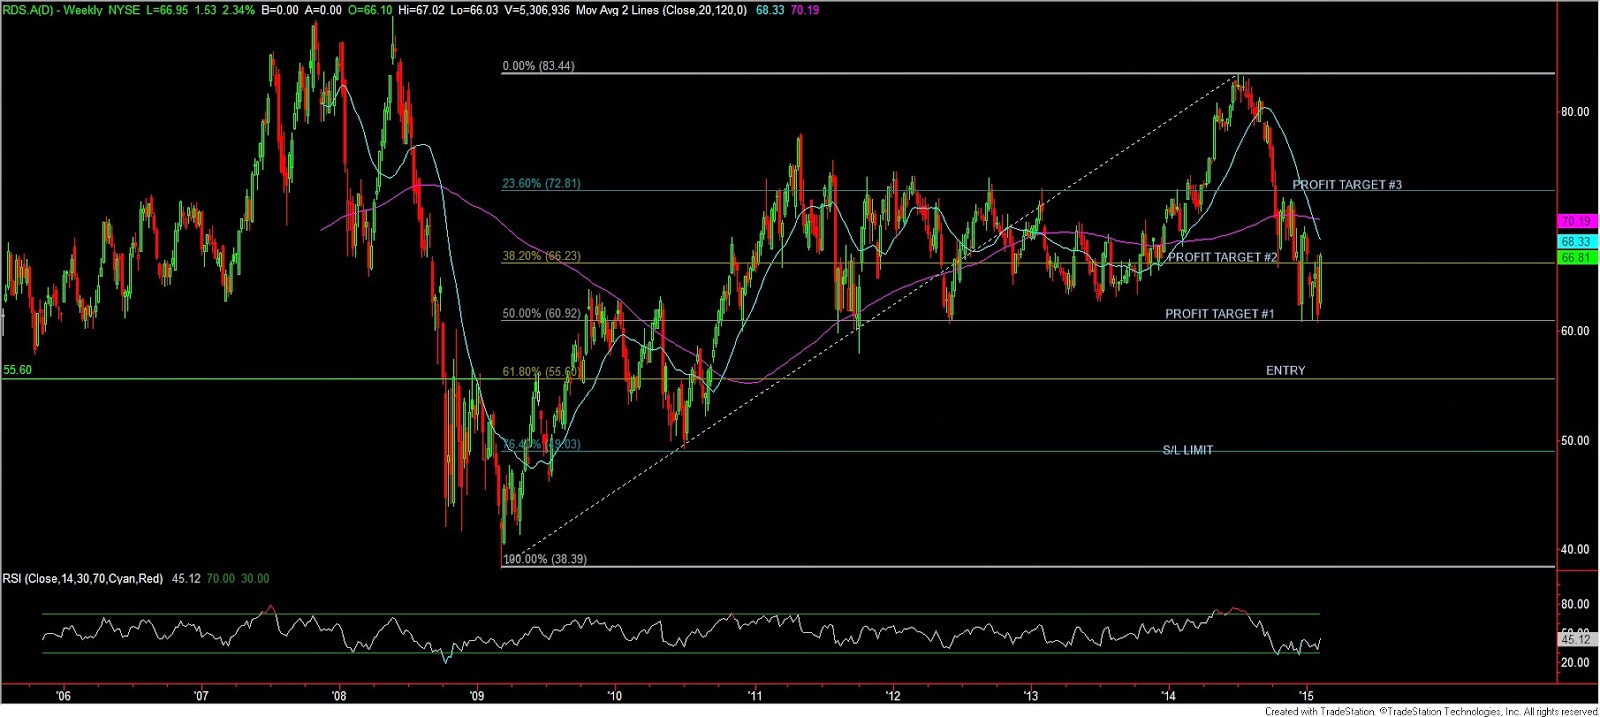
A weekly chart reveals that this stock has suffered a strong sell-off towards the end of 2014 and could be ready for more selling as moving averages trade places, signaling weakness in the markets sentiment. All that coupled with the coming infusion of cash from Shell's deal to sell its Brent Crude Operations spell out "BUY ME". 
The 61.8% fib level, $55.60, looks like the best entry price to buy this stock as it is the price action area which has served as a pivot for bulls and bears. Our stop-loss could be set to 49.03 which is also our 76.4% fib level and just below our 2010 low. Our profit targets are spread out over 3 prices. First is 60.92 which is also our 50% fib level and recent support which could act as resistance on the way back up. Number 2 is 66.23 also our 38.2% fib level and a serious price action zone. Last is $72.81 which coincidentally is our 23.6% fib level and a historically major resistance price from 2011, 2012 and 2013.

Tuesday, October 28, 2014

Awesome InfoGraphic on Wealth in the US

 This was an awesome contribution from our friends over at  www.infographicworld.com and the link for this is: http://infographicworld.com/wealth-in-the-united-states/


Monday, October 13, 2014

US Equities Watchlist

Today was an interesting day in the markets and I want to take the time to go over a few stocks for my readers who are looking for some opportunities in the markets as the end of the year looms and the mad dash to lock in profits before the year is over is upon us.

AMAG Pharmaceuticals Inc. (AMAG):
This stock gave us a nice gap up to start the month and has recently filled the gap at the end of last week and finishing the fill today. Below we have a 60min chart which shows us that the stock found new highs and slowly fell over a course of 2 weeks back down to where the gap originated from, 29.95. From here I see the stock rebounding so this looks like a great support area to test and buy from. From this support we want to see the price reach above the most recent highs around 33.00 for a breakout to and a continuation of its uptrend. If this doesn't happen then I'll be looking to short the stock around 31.50 back down to 30.00 and from there 25.00 to fill the previous gap from September 26 mentioned in one of my earlier posts.

This pair has been giving retail traders and investors the trading test of the decade lol. This stock has been hella volatile and looks like its being manipulated by big bank traders and other institutional traders. From our chart below we can observe its path of vicious whiplashes day-in and day-out. 
 From this view we can see that the stock has broken its support and Friday (10/10) showed us the market rejected it when it tried to return home at 88.00. From here we can assume that this stock will be pushed lower as it's making lower lows and 86.00 looks like the spot to sell from. 

The banks stock has taken a similar route as BABA, where the price has fallen out of last weeks range and now has broken its support at 51.00 and now is rejecting that price and using it as resistance. From here I see the price following the lower level trendline where we should see the price reach 49.50
 To keep up we probably need to get our sell order in around 50.50 and if we can't catch it there we'll wait for lower lows and catch it out of the gate around 49.75

LoL; This might be the easiest stock of them all. Buy at around 22.00
That's it.

You can listen to the news if you want but remember this; newspaper columnist and tv news reporters are not financial professionals. They get paid to write and talk. 

This stock may be lower than usual recently but that has nothing to do with the reality of business. Companies with tangible products that have proven to be money makers do not go out of business and disappear. More likely they get bought by bigger companies which can benefit from the transaction and usually save the struggling company. This pair is showing a classic opportunity where bigger institutions and companies help to degrade the price of a stock and then buy it all up under the radar. 
From the chart above we can see the beautiful gap that;'s going to get filled and it's our job to be right there when it does. From this min chart we can observe the test of the price 20  two times and the consolidation which is a sign that big traders are not shorting this stock, little (dumb) money is. Additionally peep the rising RSI trend-line. 

Posting lower lows today. Only one thing to do here, Sell Sell Sell. I was in TacoBell yesterday and realized they didn't have one of those new Coke machines that lets you make your own flavor of soda, maybe that's the reason for all the selling (lol). Whatever it is, let's be technical in our approach to selling this stock. 
From this 15min chart we can see why I say sell. I would be looking for a short around 68.90 which was support from last-week that was broken today. We need to see if this level will hols as resistance as bearish traders take the price lower. Be cautious, who wants to be caught in the middle of some hedge fund's limit-buy-order all of sudden; so keep your Stop/Loss tight. 

Friday, October 10, 2014

The Fate Of The USD

So as we all know the FOMC will be meeting again to announce their almighty important notes and we traders need to be on out toes. I want to take the time to go over some of the most important currency pairs during these hours of waiting. In This report we'll cover the most traded USD pairs available, EURUSD GBPUSD, USDCAD, USDJPY, and AUDUSD.
GBPUSD: This pair has taken a turn towards the stars and looks like it could be reversing its current downtrend. Since July this pair has been steadily drifting lower and lower and reached a yearly low of 1.60000 which acted as support for some congested trading going back to...get this...October of last year...and also the 50% Fibonacci retracement price. On the daily chart below we can see the confluence in color.
After the first test of the low the pair sprang back up to 1.64000 where it was rejected and once again fell to and then below 1.60000 before is was pressed back up to 1.61585. On the hourly chart below we can get a closer look at how this pair has been performing with this weeks movements highlighted in blue. From 1.60000 the pair took a steady path up and actually rose above its resistance before it was pressed back below it. This tells me that the traders want prices above this and their only preparing the situation strategically; so should you. 
I would be looking to sell this pair from 1.61585 and buy it at 1.60000 keeping a close eye on it just in case the banks want to take the price a step lower to the 61.8% Fibonacci at 1.57000, another great place to buy. 

EURUSD: This Pair looks like a little more fun. It has taken its drop step by step, almost in perfect lock step formation as far as the 240min chart shows. We can see from the chart below that this pair has found some good support around 1.25500. From There it has been on a consistent march back up towards the 61.8% Fibonacci level it broke about a week and a half ago. It was rejected back down from there and ended up being supported just at 1.26650 which also acted as resistance on the way down. It's good to see the bank traders are respecting technical levels. 
I'd be looking to buy this pair from or near 1.26650 with some bias to the downside so watch your position with caution as this pair has been known to be hella volatile

USDCAD: Is a completely different beast. This pair has seen some serious congestion where traders are sending the price flying and falling all within 1 or 2 sessions. On a 60min chart we can observe that this pair is still being supported by its original up trend support line but it does look to be losing some steam as far as the bulls are concerned. Around 1.11600 would be the level I'd sell from IF I was going to make any trade. I don't see much more upside potential in this pair and I don't think the banks are ready to lower it out of its uptrend just yet (think manipulation
AUDUSD: Is another pair which looks to be turning its tides from being a seller to being a buyer. Over the past week we've seen the price hit its most recent lows only to pick up Monday with nothing but buyer behind it. Though this pair has been seriously volatile we can clearly see its upswing and potential for more bullish moves. Price us testing near term support around .87500 where we could see the price bounce and continue its uptrend. I want to see .88800 cleared before I step in for a buy only because of this pair history of volatility especially during odd hours. 
 And last but not least,

USDJPY: This pair reached awesome new highs and then....nothing. It's been so lackluster I wouldn't even suggest a trade if you're not already in a successful position already. If you are in a position I hope it's a long position and I would only suggest buying more while you have a chance before the hike towards 115.000 which probably won't take long considering all the stalling that's going on in the pair now. Below on a 60min chart we can see the consolidated trading of this pair. 

Thursday, October 9, 2014

After The ECB

Last week we had one of those important ECB announcements. Let's go over what happened to all the relevant instruments this week. The market has been very interesting. [EURUSD, EURJPY, EURGBP, EURAUD, EURCAD]
EURUSD: Highlighted in blue we can see the movement of this pair throughout this entire week (Beginning 10/5) Its clear that this pair has bounced off the weekly 76.4% Fibonacci Retracement level and got back up to its 61.8% where it was rejected...so far. On the 240min chart we can see that the price has back to its most immediate support level at 1.26650. I see this pair moving higher prior to the FOMC announcements.
EURCAD: Has taken a similar route. On the 60min chart below we can see that this pair has journeyed above 1.41245 which actually has been great support for yesterday's trading and today's as well. I would treat this pair just as I would its big cousin EURUSD. Buy at support levels until FOMC announcement get nearer. 
EURGBP: Has elevated itself from its lows and is now above the pivotal .78277 level where it found support. Monday the price bounced off this price and found its way up to make new 2 weeks high around .79000. I would consider this a cautious buy because generally speaking this pair is a seller. but for now look for bouncing opportunities. On the 60min chart below highlighted in blue we can see this uptrend and the dynamics of how .78277 has been traded around, below and over. 
EURAUD: There was no point in highlighting this pair's weekly route because its in an obvious range. Yesterday gave us some hope of a breakout but it was rejected so harshly that I could hear the retail traders cries from New York to Australia. From a range low of 1.43440 to the range's high of 1.44500 there has been quite a bit on congestion. In my opinion I don't think this pair is worth trying to trade at this point. I would wait for the pair to clear 1.44500 before I reach in for a buy. 
Last but not least...
EURJPY: Also in a range but Japanese Traders are known to be a bit more methodical with they way they go about achieving prices. On Tuesday (10/6) we saw this pair reach its lowest of lows and the very next day (10/7) it reached a weekly high at 137.938. Today we saw the price collapse back down to the lows around the 136.500 level. From here I see more congestion but not before we get a chance to buy. I would be looking to buy this pair at 136.000 because Japanese Traders love their price targets and they don't like to waste time getting there. If this pair isn't reaching for new heights it's most likely looking for a particular low. Save yourself 50pips and a day of stress and wait for them to send the price to 136.000 tonight. 

Wednesday, October 8, 2014

Most Watched Stocks In The Market

This is an analysis on some of the most watched stocks in the U.S. Equity Markets today. You StockTwits kids should love this. I want you all to observe the gaps and trends which could make you a lot of money over the next few days: IF you trade them correctly.
To Start this report off we have SodaStream International Ltd. (SODA): Maker of the machine which gives consumers the ability to make their own soda at home.
From a technical perspective this stock is a bit unappealing other than the fact that it's in a downtrend. The gap that occurred after the weekend didn't excite me. That Just tells me that the market will be retracing soon to take those prices back and who knows when some hedge fund's limit order will be hit. I'd wait until price comes back towards the top of the gap around 27.50 for a short. From there I'd look for a target around 22.60 (bottom of the gap). Below Is a 15min chart which shows us The area which needs to be filled (in blue) and the consolidated trading from yesterday which rolled over into more falling today.

Next up we can take a look at Yum Brands Inc. (YUM) which is a beverage and fast food conglomerate. We see from the 60min chart below that this pair has been dominated by serious traders. Retail kids are getting crushed no doubt. It has ranged in a gap it created back in July of this year. It made some false breakouts and breakdowns the whole way through and currently the price has fallen out of the range.
The chart above gives us a chance to see the falling RSI which is an indicator that the price is ready for some rest. Now on a 15min chart we can see that this pair was seriously congested yesterday (highlighted in lighter blue) and today it whipped the shit out of the retail traders by making a dramatic spike and crashing back down severely. Around 71.15 is the bottom of the gap and the price has been rejected back below it today. That's the area you should be looking to short this stock. 

Let's move right along to Sunesis Pharmaceuticals (SNSS):
Another stock that has gaped down. This company has seen a horrible situation since Monday because it fell more than 50% in value since then. Around 3.85 is the closes resistance for this instrument and it doesn't look like it'll be back to it any time soon. On a 240min chart we can see the price fall heavily and the heavy selling since. 
On a 15min chart we can see the stocks daunting task of recovering towards any price of sustainability which is around 2.00 but it'll have to reach that then sky rocket nearly 100% just to get to the bottom of the gap its created(Highlighted in blue). 
Technically I'd sell all day.

Cree Inc. (CREE) is an LED manufacturer and makes semiconductor products for power and radio-frequency applications. This stock has a couple of gaps it needs to fill and I'm just waiting for the market to come along and sweep up every short trader's money when it does lol. The first gap runs back to August of this year when the price fell a little over $3/share to around 46.00. That gap was never filled. The second gap came recently around the 1st of this month when the price fell from around 39.50 to around 35.90. This gap was never filled either. The 60min chart below tells the story. 
To be honest I only see a sell from what seems to be near term resistance (33.40) but be cautious for the bounce that is to come. And when it comes don't be hard headed. Shoot for the gap fills, you know the markets will punish you for being a rogue trader and thinking trends last forever. The 15min chart below helps us see a more immediate opportunity. 
The first gap to be filled will be gap #2 where it'll probably range between its extremes then on to gap #1 where it'll most like go straight for the top of the gap. 

Last but not least we have Lakeland Industries Inc. (LAKE) who manufactures & sells safety garments & accessories. This stock has been fun recently. It has recently broken to important resistance levels and has risen well above its bullish trendline. The first resistance level was broken at around 8.00 and from there the price elevated to around 9.78 where it broke though yesterday and met some heavy resistance which we can observe from out 60min chart below.
 This gave me the idea to buy but then I kept going with my analysis. I observed that the reversal candle was a bit bearish and a bit engulfing lol. So then I considered the RSI...It was bearishly diverging from what the price was doing. On The 15min chart below we can see the divergence much clearer and we can also see the near term support we are testing today: If this doesn't hold I'm looking at a sell from around 9.83 back down to 9.00 then 8.00 if that doesn't hold. 

Thursday, October 2, 2014

The ECB Effect

So the ECB posted its rate announcement today and it was...to say the least; BORING. They didn't change anything actually but there was a reaction. Lets go over how the most relevant currency pairs reacted. Highlighted in blue is a two-day view of the pairs price along with its High and Low between the two days.
Has been falling steadily for over 30 days straight pretty much but yesterday it was pretty much congested and stuck in a range just before the end of the day when it consolidated; which is expected before news. What Most people didn't expect and what I predicted was the bounce in this pair. Contrary to the downtrend the market turned to the upside today. I know that banks and institutions use news for reasons to instigate sentiment and direction. This is what they did today. They sent the price all the way up to 1.26908 approx. 108 pips from yesterday's low of 1.25828. If we get a close above today's high/resistance(1.26650); we should see this pair turn to the upside for an extended period. The 60min chart below shows us what I'm talking about. Observe the RSI above 50 today... 
This pair has been on a downtrend as well but there is no rest for the weary when it comes to the Yen. Traders have been relentless in their pursuit to acquire yen for exchange for European Currencies. Monetary policies have created this atmosphere. Yesterdays high was met by a shooting start at 138.799. Towards the end of the day yesterday we saw our support of 138.00 broken, the pair slid into the London Session saw a new low of 136.947 and the price became congested around the time of the ECB Rate News; Leading me to believe the bank traders were simply trying to confuse the retail markets as well as get customer orders in before the price got away from them. Below on a 60min chart we can observe this behavior. 
So yesterday this pair fell but managed to pick itself up during the Asian Session and end the day just barely higher than it opened. Today was a completely different story. I wasn't sure when but I know there would be a bounce in this pair and boy oh boy did it bounce today. I knew this because of the consolidation without range I noticed on the 60min chart. Below on that same chart we can see the pair test a low of .77660 yesterday AND the day before that without breaking down. From there the pair used the new to bolster itself up to a high of .78497; passed the .78277 intra-week resistance. I see the tide turning for this pair and more positive days in its future. Below we can observe the RSI moving from below 50 to overbought in just 48 hours. Interesting. 
The Australian traders are giving the markets hell right now (lol). If you don't know anything about the Aussie traders and pairs I'll give you a bit of advice: Be early, because they move fast and often. This pair took a nice ladder up over the past few weeks and ended up going haywire in a realm of congestion just as it met new highs. Yesterday the pair failed to make a higher high (1.45609) and ended up falling dramatically. It ended the yesterday near its opening price and  roamed into today falling below its medium term support (1.44500) which looks like it could now serve a resistance. Today it has successfully made a lower low at 1.43447 and has began to retrace towards the aforementioned resistance test. Below we can observe the pair's RSI just above 50 but that seems to be the signal for the bears to come in and take control. 


Tuesday, September 30, 2014

Trades Worth $1 Million

Not only have I identified some awesome opportunities in the US Equity Markets, but I have also identified some great opportunities for profits in the FOREX Market as well. So I usually stick to the "majors" just to keep things simple but today I'm reaching into the "minors", no "exotics" though.

EURCAD is an interesting pair to consider at this point with all of the EURO weakness in the markets. Traders have been selling the pair heavily since the ECB rate announcement over a month ago. On daily chart below we can clearly see some support around 1.41245 which was resistance back in October of last year...Like I said, interesting. We know markets trade in mirror form basically reflecting whatever was before into the future and either repeating it or doing the complete opposite and doing so in the same fashion as the prior market moves.
Upon closer examination we see that this pair has been doing a bit of testing of traders and prices. The RSI has been slowly rising while price has been congested in a wide range. Below on the 240min chart we can see that this pair has tested the traders by breaking 1.41245 on an intra-day level, probably shaking out weak players, but ultimately respecting 1.40500.
 I see a buying opportunity from 1.40500 for the serious traders but for the newbies and skilled traders I would suggest waiting until the pair has taken over 1.44000 to ensure your mental state is not corrupted by evil bank traders with more money than you and less worries than you (lol). 

GBPJPY has been consolidating in a shitty range for a couple of days at this point giving traders very few options with ways to trade this pair. On the daily chart below we see the pair stuck under 178.737 but above 177.097 
On the 60min chart below we see the pair in such a slow moving tight range that it's hard to even get an entry on either side of the extremes. That leads me to believe that a drop lower towards 175.270 could be coming to take the price down to recent resistance that was broken to test it for a new support level.
If not the pair will rise through 178.737 from  the range low at 177.097

EURGBP is looking pretty shady. I have no entry yet but I do have some signals that tell me something serious is coming for this pair. Not only has its decline been sharp and swift but it has come with some divergence from the RSI, where we see a slight rise. This tells me there's extreme manipulation going on and the big traders have been suppressing the price (probably because its the easiest EURO pair to sink lower by force.). Below on the daily chart we can see the clear mis-communication between the price and its price's strength.
Wait for a floor and then buy.

EURJPY is showing us some signs of a reversal. Recently the pair has seen some heavy buying going on and is now above an important resistance line that is now acting as support 138.373. Not only has the price been elevated recently but it has broken above its downtrend resistance trendline. The daily chart below spells out the story for us.
Along with a snap of the trendline we see the RSI above 50 but below 70. This is an awesome time to buy this pair! I say buy at/around 138.373 for an initial profit target of 141.215 (recent high). 

GBPUSD is a prime candidate to start building long positions in. On a 240min chart we can clearly see the pair respecting 1.61585 and our RSI is moving our of oversold territory to give traders a chance to join the big boys for the long ride home back to the highs we associate with this pair. 
From an entry at or around 1.61585 I set my profit target my profit target at 1.64000 and after that, the sky is the limit. 
 As for USDJPY I say...Stop being so afraid of 110.00, we all know the banks are going to take this pair to 115.00. I have a video posted (right side of page) that even tells us the likelihood and story of the trip. Below on a 60min chart we can see timid traders waiting for the banks to come back to this pair (and out of EURGBP) to send the price higher for us.
 If you're like me and got in around 105.00 be strong and confident, wait, you'll be happy you did.