Showing posts with label earn. Show all posts

Wednesday, April 1, 2015

Q1 Stock Portfolio Review

I had an awesome quarter in my Forex portfolio returning over 49% in just the first 90 days of the year. A good investor and trader doesn't have to limit their self to trapping out of just one market. I also use my talents to trade and invest in the U.S. Equity Markets which has been good so far. In this post I will outline some of my trades and show charts to illustrate the plan for the investments. This portfolio does have a different strategy than my Forex portfolio but I use the same competencies to accomplish beta. Although my strategies are different the results are the same; I make money.

My Watch-list included:
SPWR
FGP-filled - $23.61
BBY--->SWITCHED to BBRY- filled - $9.33
AAPL
DOX
JPM-filled - $59.87
C
GS
ADK-filled - $4.28
ALXN-filled - $180.87
ZMH-filled - $119.72
BMRN
Not all of my entries have been filled so there is no information on the results of these stocks in my portfolio. 
About half of my portfolio is active so far and it seems to moving along fine. Through the ups and downs the swings have been bearable and the entries look like good support levels. 
The key to managing a portfolio to beta is to rely on diligent research and master patience. There were days when a particular stock would be only pennies away from my entry target but one must exert true self-control and wait for the planned opportunity or better. When I enter a trade I am sure this where I want to be and I know what I will do if prices move to place I do not want to be. 

Here are charts displaying some of the positions the portfolio is currently holding.


IF YOU'RE INTERESTED IN INVESTING IN THE FUND OR BECOMING AN ASSOCIATE TRADER FEEL FREE TO REACH-OUT TO ME. 

Thursday, October 2, 2014

The ECB Effect

So the ECB posted its rate announcement today and it was...to say the least; BORING. They didn't change anything actually but there was a reaction. Lets go over how the most relevant currency pairs reacted. Highlighted in blue is a two-day view of the pairs price along with its High and Low between the two days.
Has been falling steadily for over 30 days straight pretty much but yesterday it was pretty much congested and stuck in a range just before the end of the day when it consolidated; which is expected before news. What Most people didn't expect and what I predicted was the bounce in this pair. Contrary to the downtrend the market turned to the upside today. I know that banks and institutions use news for reasons to instigate sentiment and direction. This is what they did today. They sent the price all the way up to 1.26908 approx. 108 pips from yesterday's low of 1.25828. If we get a close above today's high/resistance(1.26650); we should see this pair turn to the upside for an extended period. The 60min chart below shows us what I'm talking about. Observe the RSI above 50 today... 
This pair has been on a downtrend as well but there is no rest for the weary when it comes to the Yen. Traders have been relentless in their pursuit to acquire yen for exchange for European Currencies. Monetary policies have created this atmosphere. Yesterdays high was met by a shooting start at 138.799. Towards the end of the day yesterday we saw our support of 138.00 broken, the pair slid into the London Session saw a new low of 136.947 and the price became congested around the time of the ECB Rate News; Leading me to believe the bank traders were simply trying to confuse the retail markets as well as get customer orders in before the price got away from them. Below on a 60min chart we can observe this behavior. 
So yesterday this pair fell but managed to pick itself up during the Asian Session and end the day just barely higher than it opened. Today was a completely different story. I wasn't sure when but I know there would be a bounce in this pair and boy oh boy did it bounce today. I knew this because of the consolidation without range I noticed on the 60min chart. Below on that same chart we can see the pair test a low of .77660 yesterday AND the day before that without breaking down. From there the pair used the new to bolster itself up to a high of .78497; passed the .78277 intra-week resistance. I see the tide turning for this pair and more positive days in its future. Below we can observe the RSI moving from below 50 to overbought in just 48 hours. Interesting. 
The Australian traders are giving the markets hell right now (lol). If you don't know anything about the Aussie traders and pairs I'll give you a bit of advice: Be early, because they move fast and often. This pair took a nice ladder up over the past few weeks and ended up going haywire in a realm of congestion just as it met new highs. Yesterday the pair failed to make a higher high (1.45609) and ended up falling dramatically. It ended the yesterday near its opening price and  roamed into today falling below its medium term support (1.44500) which looks like it could now serve a resistance. Today it has successfully made a lower low at 1.43447 and has began to retrace towards the aforementioned resistance test. Below we can observe the pair's RSI just above 50 but that seems to be the signal for the bears to come in and take control. 


Tuesday, September 23, 2014

Buy Weed

In the wake of Colorado and Washington legalizing Marijuana for recreational use you're out-dated and crazy if you think there's no money or future for the Cannabis Industry. You're also crazy to ignore Peyton Manning telling us he's benefited from legal Pot Business and an Alaskan News reporter quitting on air with a hint at her conversion to the Weed business. To show you all what I mean when I say this blog is the New Generation of Finance I'm going to write a short report on 3 cannabis stocks that could work for any investor and their strategy. Whether you're a day trader, swing trader, or equity investor these stocks will work for you.
Consistency- If you're looking for a consistent stock that could earn you a healthy profit I would look towards a business with a product, service, and outlet for their business. MedBox (MDBX) is a great example of this kind of company because they make automated dispensing solutions for medications, including marijuana. So if it makes you feel any better their sole business is not cannabis alone. They also have the largest capitalization of all cannabis linked stocks with a $1.2 billion capitalization and does not file with the SEC. Below is a chart which shows a cycle of slow slow sell offs lasting months with the strongest support of any instrument I've ever seen and it looks as if this is what happens year after year.

Volatility- If you're interested in some action on a weekly basis I would look towards GW Pharma (GWPRF), one of the few cannabis stocks that trades on a major exchange (Nasdaq). This company is based in the UK and is biotech. They develop cannabinoid medications primarily for multiple sclerosis and cancer. They too have one of the largest market caps at $930 million. The daily chart below shows me this stock has been supported and respected in the markets. Since its IPO it has not turned around and has only elevated.
At closer examination on the 60 min chart below we clearly see the fun part of this story. The pair creates predictable and trade-able GAPS!! This might seem scary but you must look at the bigger picture. An uptrend since inception.
Value- Our value cannabis stock of the day is a company by the name of mCig (MCIG). They create an interesting product which is a $10 mini-vaporizer for dry Cannabis or Cannabis Wax. The best part about this company is that they didn't release their first generation of products until October of this year and from the daily chart below we clearly see how the markets have responded. In my opinion this stock is an excellent value. The company is just getting started, has a good product that it actually sells, its stock price exploded but is giving investors an opportunity to jump in where we see the price come back to its long term resistance level that seems to be acting as support. From these levels you're looking at growth that could be passed down to the generation Y's in your family.  

Thursday, September 4, 2014

Playing chicken with a Mack Truck

So the ECB decided to take it upon themselves to drop the Federal deposit rate to .05%. This sucks because now there is essentially no insintive to own any EUROs. We American traders should be looking at Europe with a predator's focus. After the initial slaughter of the the EUR/USD there will probably be a host of carry traders lining up to buy those poorly paying euros in exchange for some higher yielding currencies like the AUD or NZD. The USD has a poor federal funds rate as well but not nearly as pitiful as Europe's so we should see some methodical purchasing from the international client having banks soon. If you've been following my recent posts you should ultimately be profitable from my suggestion to short any EURUSD pop ups. Fly balls look like home runs until the ball starts to fall and you see just how far the fence really is. 

On another note, I went H.A.M on Tuesday and placed about 7 orders. I shorted NZDUSD @ .833 & USDCAD @ 1.09. Canadian traders took my out for a gain of 50 pips and my friends in New Zealand are earning me money with about 22 pips on my belt buckle. AUDUSD and GBPUSD have been on my radar and I won't tell you how or why until they tell me what I want to hear. 


Tuesday, September 2, 2014

GOING H.A.M.

So tonight I loaded up on orders because I've been on the sideline waiting for a few pairs to decide what they ultimately want and it seems as if they've made they're decisions. I'm not going to tell just what orders I've sent because I feel like we still have a lot to do to turn this EURUSD long trade into some profits. So far I've been shorting the pops in the pair but in between my large Lon position I've been building since price was around 1.33. As of tonight the price is around 1.313 just 20 pips away from our 1.315 support price and well into the support zone which bottoms out at 1.31. These levels represent a 61.8% retracement level from the 2014 highs. I'm bullish on this pair but it'll take some time before the price can support higher offers. The lower bids are drying up and daily candles are becoming doji designs for the retail traders to try and figure out.
For now I'm looking towards GBP, NZD, JPY and CAD for near term action with Canadian and Japanese monies capturing my preference for trading. Tomorrow iff one of my orders is taken, will I reveal all of the orders I placed today. 

Tuesday, August 5, 2014

EURUSD SWINGING

So it's been about a week & a half and the EURUSD has been steadily declining but meeting some support around 1.336 as seen in the picture below. Interestingly enough we anticipated a spike up towards 1.35 but happy to see the momentum ended around 1.345 as also seen in the figure below.
Now the most important thing to remember at this point of the stalking/pre-trade of our 1.33 BUY. As of now we are 69.2 pips away from our entry target. 1.345 will be tested again so one could consider that price as a potential level to sell for a 150 pip gain towards 1.33; 1.35 can be used as the S/L for this set up. That gives you a 1:3, RISK:REWARD ratio trade with a 150 pip profit target seagwaying into you're big boy trade the 1:33 BUY. So let's what the rest of the week brings and trade hard. I'm in PA btw. 

Wednesday, July 30, 2014

Low Volatility = Swing Trades Pt. 1.6

On this beautiful Wednesday we await the U.S. Feds Rate Statement. My original assessment of the $EURUSD pair stated that we should see its price drop to around the 1.33 level by earlier this week, Monday or Tuesday. Obviously we are running behind schedule but not by much. Price currently stands at 1.33780, exactly 78 pips from our entry target. PLEASE BE PATIENT, because this isn't a support level nor was it ever a resistance level. Don't let the fed news spook you out of profitable positions and don't let the institutional traders entice you to trade with them. Instead let the market reaction either carry you to your destination (1.33) or provide you with an opportunity to relive the most recent market move down (from 1.35). Sell the pops at intra-day resistance levels and buy the dips around and below 1.33. 
The pair is still in its 46 pip daily range so a move to 1.33 from 1.33780 should take us all of 2 days to complete lol. 
Stay local for PT. 2 of this adventure, Low-Volatility= Swing Trades, for the next step to profiting from the $EURUSD and the upcoming news & events. 

Also be sure to check out www.tradingtheyen.com/blog, my new blog, for the best news, entertainment and commentary in finance. 

Thursday, July 24, 2014

Low-Volatility - Swing Trades Pt. 1.4

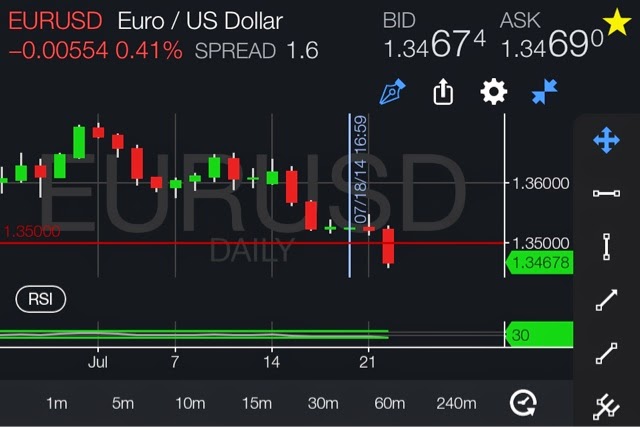
Today the $EURUSD was met by some indecisive traders. I guess the US initial jobless claims confused the traders and they ended up ranging the pair for the day only giving it a neglegable uptick. For all you traders who think you're seeing a doji candle formation please remember that doji candles at the bottom of a trend are commonly and easily collapsed by the weight of the downward market momentum already in place. So let that shit sink in buyers.
 

Wednesday, July 23, 2014

Low-Volatility - Swing Trades Pt. 1.3

So it's clear that today showed a lot of indecision in the EUR/USD. The pair stayed in a tight range all day but still below the 1.35 support that was broken yesterday. All the haters looking to fade the breakdown are about to be shaken out by the pros as they cause the maket to move sideways and erratic until the path is clear to either drop further or reverse and start marching up. As the buyers of 1.35 panic and start buying more to average their already losing poisons.. I mean positions, or they sell to get out of their losers, they'll push the mRket down lower and the institutions will most likely be really happy to take the orders. I'd sit on the sideline until the LONDON session to watch for bids towards the broken support to clean up lingering orders and to see if they might want to save everybody some time and just drop the pair a hundred pips or so to cause a free-fall. None-the-less be attentive tomorrow as today wasn't easy or helpful like yesterday and we might see some action that could really shift the market. 

PS: AT THE END OF THE WEEK I'LL BE ANNOUNCING SOME AWESOME NEWS SO TUNE IN FOLKS!! 

Tuesday, July 22, 2014

Low Volatility- Swing Trades Pt.1.2

So the EUR/USD broke the 1.35 level today as I expected it to and as I wrote about yesterday. From here you can sell the pair down to the 1.33 level while watching for support buyers that can make the pair suddenly pop during the more volatile times of trade (US and LONDON sessions). This will provide you with trend riding trades all week until we reach our 1.33 entry at which we should stalk the price to confirm the support and watch the market makers shake out the amateurs trying to pick bottoms with the hopes of a sudden reverse; Which I might add is not likely to happen in 1 session or even 2. So stay tuned!!
 

Monday, July 21, 2014

Low Volatility= Swing Trades pt1: Before the Trade

In these times of low volatility and ranging markets in the Forex markets (outside of the recent GBP strength) we are presented with a great opportunity to create beautiful swing positions  in the some currency pairs! As some of us may know, volatility refers to the amount of uncertainty or risk about the size of changes in a security's value. A higher volatility means that a security's value can potentially be spread out over a larger range of values. This means that the price of the security can change dramatically over a short time period in either direction. A lower volatility means that a security's value does not fluctuate dramatically, but changes in value at a steady pace over a period of time. Thanks Investopedia lol. So basically swing positions need low volatility to perform optimally. This is because they depend on time market participants to cohesively move the instrument lower steadily as to not touch stop-loss orders and trailing stops. Dramatic price swings in volatile markets reach to touch these orders which upsets the entire position. 

PAIR AVAILABLE FOR SWING TRADE:

EUR/USD is the perfect pair to stalk for the next week or two because it's been loosing lots of volume and volatility moving towards it's 2014 low. As of now the pair is testing it's previous price of 1.35 which was most recently supported Friday (July 18) and before that June 5. Right now the pair's RSI on a daily chart shows bullish divergence from May 28th where price was 1.35864 and the RSI was at 27.1. Most recently (July 18th) the price has moved lower to 1.34903 with a higher RSI of 36.55!! This gives me the impression price wants to move higher but the pair isn't trading in that fashion which tells us to wait a bit. 

From 1.2744 the pair has seen a high of 1.39928 which is now the swing high.  The price 1.35 is around the 38.2% retracement of this swing while 1.33 is the nearest round price to the 50% retracement of this swing. With the 50% Fibonacci level being the most often tested price level along with the lack of upward momentum off 1.35, leads me to believe there's more room to the downside for this pair. 

The ATR is around 43 pips daily which we can say will lead us to our entry target at 1.33 by the end of the week or the beginning of next week. By the 28th of July the ascend towards 1.38 should begin. 
      1.38 is our most recent resistance  which was support for the upswing in April and May. Our first target should be reached by around August 11th or 12 days or so. Our next target of 1.400 (just above our swing high looking for new high) should be reached around 5 trading days later which would be around August 18th.
 
#  Beware of Wednesday July 30th as the US Fed. Bank announced it's fed fund rate. I think you know how important this is so try to already be locked into profits (at least +43 pip). By now price could be around 1.34 and if price retraces to 1.33 and holds I would look for an opportunity to increase my position size.
#  The next day to fear is Wednesday August 6 when the ECB announces it's EURO minimum bid rate which essentially the same as what the US fed bank will be doing in July. On this day you can look for a pull back to a previous resistance that may turn into a new support for another opportunity to increase your position size.  

With an entry of 1.33 we can safely set our stop/loss at 1.32 or -100 pips. From a 4-hour chart  view we can see the last downtrend from September 2013 was the next resistance level on the 4th and 5th which can now act as our 1.33 buy support on our way up this 2014 August. [That's almost perfect market symmetry, off by maybe 20 days lol.] Below 1.32 the next support we can assume is 1.28 which would disrupt any risk tolerant trades. From 1.33 to our target 1.40 we are pretending a 700 pip profit. From 1.33 to the next EXTREME support 1.28 we pretend to assume a 500 pip loss. Even if we took this trade our risk reward:ratio would be 1:1.4. Our trade isn't so risky as we are setting our stop/loss -100 pips away. That gives our trade a 1:7 risk:reward ratio, WITH confluence in indicators and price & volume. 

With respect to the law don't copy this idea lose money and try to blame it on me. If I trade this plan I'll make money because I know my strategies and plans. If you want to trade and make analysis like me let me know. And don't say I never gave you any ideas.  


PS: IM IN FLORIDA RIGHT NOW