And for the market of illegal goods and services one must recognize the major differences that make these two economies separate. For it isn't the fact that the goods and services of the black exchange market are illegal that make it different; that is merely a price exaggerating factor.
The true characteristic which gives the black market it's power to control markets trends is the markets emphasis on products rather than consumers. For in a black market products are controlled by cartel-monopolies(conglomerates of cartels controlling every aspect of an industry) making competition and more importantly OPTION non existent essentially. That strips away the power for the consumer to choose between different styles of the same good.
So the consumer is no longer distracted by brand choices but more so the utility of the good they are obtaining. ---the sad true fact is that the black market is the last true international trade organization in the world in which an average person, not normally dealing in large quantities to supply a region or space, can trade and exchange a range of goods and services, illegal or legal, to obtain a good or service, illegal or legal, they desire, with cash, being one of many options as a form of payment, or in exchange for other goods and/or services.
So instead of a consumer purchasing demand market you have a consumer dependent upon inventory consistency market, where price is determined by a reversed supply and demand scenario. The consistency of a suppliers inventory dictates the demand of the market and its prices.
Now on another note, we should examine the case of unregulated legal markets with actors doing illegal activities.

Showing posts with label Markets. Show all posts
Showing posts with label Markets. Show all posts
Wednesday, November 27, 2019

Monday, October 13, 2014
What's In Your Wallet?
The past few weeks have been great in the Forex Markets... If you're a good trader (lol). So recently We've seen movement across all regions especially the European markets and US. I want to take some time to look over a few pairs from a range of regions around the world to give my Forex Traders a birds eye view of where the money is and how to get to it.
USDJPY:
After weeks of beautiful buying right to our target of 110.000 this pair has now backed off in the most interesting way. No heavy selling but a steady grind lower; My idea is that this pair is falling to support at 107.000 before it takes off towards 115.000. Indicators are telling us that the price wants to take a turn for the worst but we must be patient and hold on to our long from 105.000 until we see that the bears truly want to destroy everything we've built.
 From this 240min chart above we can see that the pair has consolidated quite a bit but has moments of serious volatility which we can benefit from but must ultimately be cautious of. Buy more at 107.000 if it holds but be ready to close early if it doesn't. Try again at 105.000.
 We need to see 1.61500 taken so we can see 1.62000 taken so we can officially say this downtrend leg is over and we can continue with our monthly uptrend. Start looking to build your long positions.

 Today the pair broke its resistance with a strong bullish candle. I see this pair moving higher shortly. My idea here is to buy from the resistance in hopes of it acting as support now for a stronger and bigger move higher.
 Pick-A-Side.
USDJPY:
After weeks of beautiful buying right to our target of 110.000 this pair has now backed off in the most interesting way. No heavy selling but a steady grind lower; My idea is that this pair is falling to support at 107.000 before it takes off towards 115.000. Indicators are telling us that the price wants to take a turn for the worst but we must be patient and hold on to our long from 105.000 until we see that the bears truly want to destroy everything we've built.
From this 240min chart above we can see that the pair has consolidated quite a bit but has moments of serious volatility which we can benefit from but must ultimately be cautious of. Buy more at 107.000 if it holds but be ready to close early if it doesn't. Try again at 105.000.
Has been a retail market murderer. The banks did a classic dramatic sell off and now all the small (dumb) money traders think its in a down trend...check your monthly charts. With that being said I'm heavily bullish. This pair has created a nice uptrend that started at the beginning of this month. it has made higher highs and higher lows. It reached a high of 1.62250 which alerted me to start paying attention. Fortunately there's been a pullback to its support at around 1.60400 which has held 3X's so far. On 10/11 the pair reached a low touching the weekly chart's 50% fib level and then turned around for a beautiful march into Sunday (10/12) Asian Session trading. Today it respected a bit of resistance at 1.61200 and also intra-day support at 1.60500 LMAO. See what I mean. Up and down, up and down is the story this pair is telling.
We need to see 1.61500 taken so we can see 1.62000 taken so we can officially say this downtrend leg is over and we can continue with our monthly uptrend. Start looking to build your long positions.
This pair looks like it's finally coming out of its downtrend and ready to move on to bigger and better prices. From a daily chart perspective we can see that the pressure to the downside is still very relevant but I'm not fooled by the NY and European Traders' antics. They've reached their price target (Profit taking Fibonacci Level) and today the traders overtook 1.26650 resistance so I'm looking to build early long positions here. From 1.26650 with some caution for the downside play.
This pair is looking similar to EURUSD. With a long standing downtrend in its way a lot of traders don't see any upswing in this pairs future. From my daily chart below I see something different; this pair is crossing over its into buy territory on the RSI indicator...and this indicator is lagging.
Today the pair broke its resistance with a strong bullish candle. I see this pair moving higher shortly. My idea here is to buy from the resistance in hopes of it acting as support now for a stronger and bigger move higher.
Last but not least,
Having a nice selling period as traders take profits and look for better prices to buy from. On a 240min chart we can see that this pair is ready for a stronger move lower which is where the GBP bears will get their chance to sell but they better do it quickly. This pair is approaching an important support line at 171.644 which is just above the gap-up from September. If this isn't held sellers have a second target at just below 171.000. All These prices are good places for buyers to consider their orders. I know these are contrary ideas but the markets are giving us signs of multiple opportunities and only 1 will be immediately correct...
Pick-A-Side. Friday, October 3, 2014
Hacked Market Trades Made Me Over $10k
This week has been a pretty lackluster one in my opinion. Not good for trend trading but an awesome week for some day trades. I made Over $10,000 in USDJPY by holding on to the rest of my long position from way back when I bought it at 105.00 and I intend to hold it even longer after seeing the markets Post-ECB emotions.


On a 240min chart we can see the uptrend begin to consolidate but still provide us with small momentum towards the upside. This may not be the best environment to try to buy and hold any trades more than a few hours to a day at most.
For a view of something we could've actually traded we should move to down to a 60min chart. Below on the chart we can see highlighted in blue a 5 day view of this pairs movement; What we observe is that this pair provided at least 15 pips everyday that could have been sucked out of some day trades. Monday we rose during the London Session only reverse the entire move + some. Tuesday We see the pair rise 15+ pips during late London/Early New York Sessions and consolidate into the end of the day. Wednesday Was an awesome day because we got to see the pair test 110.00 for resistance twice only to fall 20+ pips. The Fall continued into Thursday and reached a floor towards the end of the New York Session. Once the floor was reached during the Asian Session the pair decided to march over 100 pips which lasted through Today's London Session and New York Session.
If you were looking for some action this week USDJPY was just one pair that provided daily pips for the acute traders.
Monday, September 29, 2014
High-Pay Stocks For Busy People
Last week was a great week in the FOREX market, but I like to reach across all markets so this week I'm looking at a few stocks that show some good potential to move. To be honest I'm not really into day trading stocks because for some reason the stock market actually believes in fundamental analysis. Don't get me wrong, I'm not saying the analysis of opinions and events isn't worth a damn, I'm just saying I prefer to trade markets where their effects aren't so dramatic.
To start this thing off I want to bring attention to a previous employer of mine which took a 26 year vacation from the public trading floors only to return with a vengeance, Citizens Financial Group (CFG) went public last week and they did so in style!! Although there isn't much technical analysis to do on this instrument its charts still tell a good story and show signs of healthy growth in its future. Below is a 5min chart which shows us the Royal Bank Of Scotland (RBS) owned Retail bank took off from its Initial Public Offering (IPO) price ($21.50) and has't turned back since. I'm looking to get into this value priced stock before the price becomes too pricey!


To start this thing off I want to bring attention to a previous employer of mine which took a 26 year vacation from the public trading floors only to return with a vengeance, Citizens Financial Group (CFG) went public last week and they did so in style!! Although there isn't much technical analysis to do on this instrument its charts still tell a good story and show signs of healthy growth in its future. Below is a 5min chart which shows us the Royal Bank Of Scotland (RBS) owned Retail bank took off from its Initial Public Offering (IPO) price ($21.50) and has't turned back since. I'm looking to get into this value priced stock before the price becomes too pricey!
Next up we have Alibaba (BABA) which has surprised US investors by taking a turn to the downside after a decent IPO. The Price has been suppressed and congested since its heavy decline the day after its IPO. But to be fair the stock is showing some interesting behavior on its 15min chart which has just now become useful because of the instruments infancy. From the chart we can see an obvious wedge which favors the upside, only because the recent lows have been getting higher and highs are testing intra-day resistance levels. A break above the upper boundaries sends us to test its opening price and in case of a break below lower boundaries we will see a test of the all-time low at $86.62.
Now I've talked about MCIG before when I wrote about which Weed Stocks were worth looking into. We see from the daily chart of this company's stock that it has suffered from some serious distribution which has taken its price below its long standing support of .2604. We now see the stock attempting to rebound but it looks like this is only a play towards the old support which will most likely be turned to resistance. I would buy this pair until a true floor has been designed on a daily chart. For now a sell from the aforementioned resistance will do.
Now not too long ago someone on StockTwits (@joekidd) called me out on my Citigroup (C) prediction. I saw a short opportunity and this guy didn't think it could be true but today I want everyone to observe a false breakout which is one of my favorite events to take place because I usually walk away with such easy money. This stock has done a typical run up out of its range only to collapse back down into it and then move towards its bottom end nearly touching my profit target at $51.10. If you want to play the game the right way, buy at the bottom of this range...trust the lord of trading. Don't be like the kid joe.
AMAG has completely disrespected my initial set-up so now I say, buy it. The 60min chart shows us that this stock clearly has some supporters and they wanted the price completely out of its range and today it gaped up over $3 higher than its close on Friday $23.08. Jump in at the previous high $24.87 which should turn to support.
So if you're looking for some stock you can earn from without having to babysit your account all day than I would consider all of these stocks. They aren't too expensive and the offer enough volatility to make money quickly but not too much volatility that its impossible to set and forget which is always the goal.
Tuesday, September 23, 2014
Buy Weed
In the wake of Colorado and Washington legalizing Marijuana for recreational use you're out-dated and crazy if you think there's no money or future for the Cannabis Industry. You're also crazy to ignore Peyton Manning telling us he's benefited from legal Pot Business and an Alaskan News reporter quitting on air with a hint at her conversion to the Weed business. To show you all what I mean when I say this blog is the New Generation of Finance I'm going to write a short report on 3 cannabis stocks that could work for any investor and their strategy. Whether you're a day trader, swing trader, or equity investor these stocks will work for you.
Consistency- If you're looking for a consistent stock that could earn you a healthy profit I would look towards a business with a product, service, and outlet for their business. MedBox (MDBX) is a great example of this kind of company because they make automated dispensing solutions for medications, including marijuana. So if it makes you feel any better their sole business is not cannabis alone. They also have the largest capitalization of all cannabis linked stocks with a $1.2 billion capitalization and does not file with the SEC. Below is a chart which shows a cycle of slow slow sell offs lasting months with the strongest support of any instrument I've ever seen and it looks as if this is what happens year after year.
 Volatility- If you're interested in some action on a weekly basis I would look towards GW Pharma (GWPRF), one of the few cannabis stocks that trades on a major exchange (Nasdaq). This company is based in the UK and is biotech. They develop cannabinoid medications primarily for multiple sclerosis and cancer. They too have one of the largest market caps at $930 million. The daily chart below shows me this stock has been supported and respected in the markets. Since its IPO it has not turned around and has only elevated.
 At closer examination on the 60 min chart below we clearly see the fun part of this story. The pair creates predictable and trade-able GAPS!! This might seem scary but you must look at the bigger picture. An uptrend since inception.


Consistency- If you're looking for a consistent stock that could earn you a healthy profit I would look towards a business with a product, service, and outlet for their business. MedBox (MDBX) is a great example of this kind of company because they make automated dispensing solutions for medications, including marijuana. So if it makes you feel any better their sole business is not cannabis alone. They also have the largest capitalization of all cannabis linked stocks with a $1.2 billion capitalization and does not file with the SEC. Below is a chart which shows a cycle of slow slow sell offs lasting months with the strongest support of any instrument I've ever seen and it looks as if this is what happens year after year.
Value- Our value cannabis stock of the day is a company by the name of mCig (MCIG). They create an interesting product which is a $10 mini-vaporizer for dry Cannabis or Cannabis Wax. The best part about this company is that they didn't release their first generation of products until October of this year and from the daily chart below we clearly see how the markets have responded. In my opinion this stock is an excellent value. The company is just getting started, has a good product that it actually sells, its stock price exploded but is giving investors an opportunity to jump in where we see the price come back to its long term resistance level that seems to be acting as support. From these levels you're looking at growth that could be passed down to the generation Y's in your family.
Thursday, July 24, 2014
Low-Volatility - Swing Trades Pt. 1.4
Today the $EURUSD was met by some indecisive traders. I guess the US initial jobless claims confused the traders and they ended up ranging the pair for the day only giving it a neglegable uptick. For all you traders who think you're seeing a doji candle formation please remember that doji candles at the bottom of a trend are commonly and easily collapsed by the weight of the downward market momentum already in place. So let that shit sink in buyers.

Tuesday, July 22, 2014
Low Volatility- Swing Trades Pt.1.2
So the EUR/USD broke the 1.35 level today as I expected it to and as I wrote about yesterday. From here you can sell the pair down to the 1.33 level while watching for support buyers that can make the pair suddenly pop during the more volatile times of trade (US and LONDON sessions). This will provide you with trend riding trades all week until we reach our 1.33 entry at which we should stalk the price to confirm the support and watch the market makers shake out the amateurs trying to pick bottoms with the hopes of a sudden reverse; Which I might add is not likely to happen in 1 session or even 2. So stay tuned!!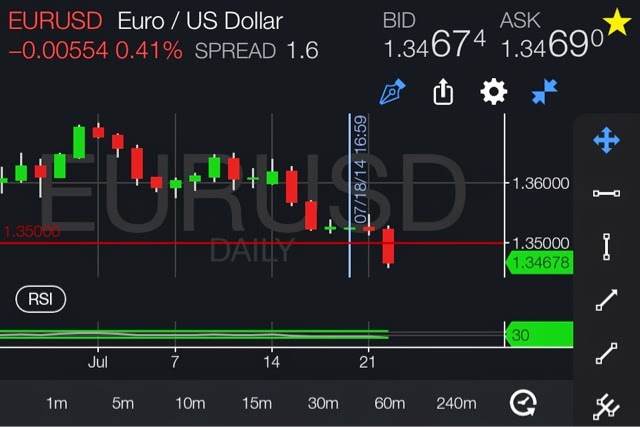
Thursday, June 26, 2014
WISE WORDS FROM A GREAT TRADER
Trading is not about control. It is about going with the flow. Trading is not about knowing the future. It is about allowing the future to take place. Trading is observation, pure and experiential. Thinking isn’t necessary and just gets in the way. Trading is the glass half empty and the glass half full, alternating without rhyme or reason by the minute. Trading is total ruin and absolute reward; dual demons that lurk around ever corner. Trading is an alluring distraction from life or a life raft on the stormy search for self. Trading is strangers offering up their most precious ideas. Trading is the clueless trying to offer ideas to their friends. Trading is your best friend who steals your spouse and your house. Trading can send us to hell or to paradise, but it always takes us somewhere we have never been. Trading is a blessing whose rules, if ignored, become a curse. Trading is taking a knife to a gunfight. Knives and guns leave traces of blood, but the logic of the market is the weapon that manages to destroy without leaving clues. The mountain of trading is in the mind as the lake is level. Trading is more about knowing when not to trade than it is about trading. Trading seeks equilibrium. Trading is learning a never ending balancing act on a tight wire above a movable abyss. Trading is timing. Waiting is painful. Pain brings wisdom. Wisdom brings balance. Trading can be excruciatingly exciting when done wrong and tauntingly tedious when done right. - Jeff Cooper -


Wednesday, June 25, 2014
Never be an analyst during trading
Trading is a full mind and body sprinting marathon that lasts all of about 3 to 6 hours a day depending on which markets you trade and your strategies. I honestly don't care who you are, it takes 100% of your attention to trade any instrument correctly. I'm saying all this because I find that a big problem a lot of people have when learning to trade is that they haven't properly identified the division of labors that should be applied to the operations of a professional trader. For example "buy side" firms have analyst who do the research on particular instruments and they facilitate that information to the traders who in turn give management the best ways to accomplish the goals of the firm. The traders aren't the same guys who determine what to trade, they're too busy making sure they're trading correctly and within their strategies parameters. The fact that they don't have to divert energy and attention to research and analysis during their trading contributes to their lack of emotion and stern discipline. This is exactly why Goldman Sachs can have no losing trading days over a year, or two.
So my advice is to spend part (preferably most) of your work hours being an analyst and the necessary time trading. You should be able to set it and forget after about 250 hours of trading, in my opinion at least.
Subscribe to:
Posts (Atom)